Bot or Not Topic Networks Dashboard
Welcome to the Bot or Not Topic Networks Dashboard
This dashboard provides an interactive way to explore network visualizations and analyses of open-ended survey responses from the "Bot or Not" study.
About the Project
The Bot or Not project measures the impact of identity cues on perceptions of online profiles as bot or human. This dashboard visualizes network-based analyses of responses to two open-ended questions:
- AI Open Concerns: General concerns about the role of AI in society
- Bot Factors: Factors that made profiles seem more like bots
Responses were categorized using topicGPT to identify topics and their relationships.
Dashboard Navigation
The visualizations are organized in the following categories:
- Main Networks: Overall topic networks for both questions
- Demographic Networks: Networks broken down by demographic groups
- Comparative Networks: Visualizations highlighting differences between groups
- Heatmaps: Topic usage by demographic categories
Use the navigation menu on the left to explore the various visualizations and analyses.
Featured Visualizations
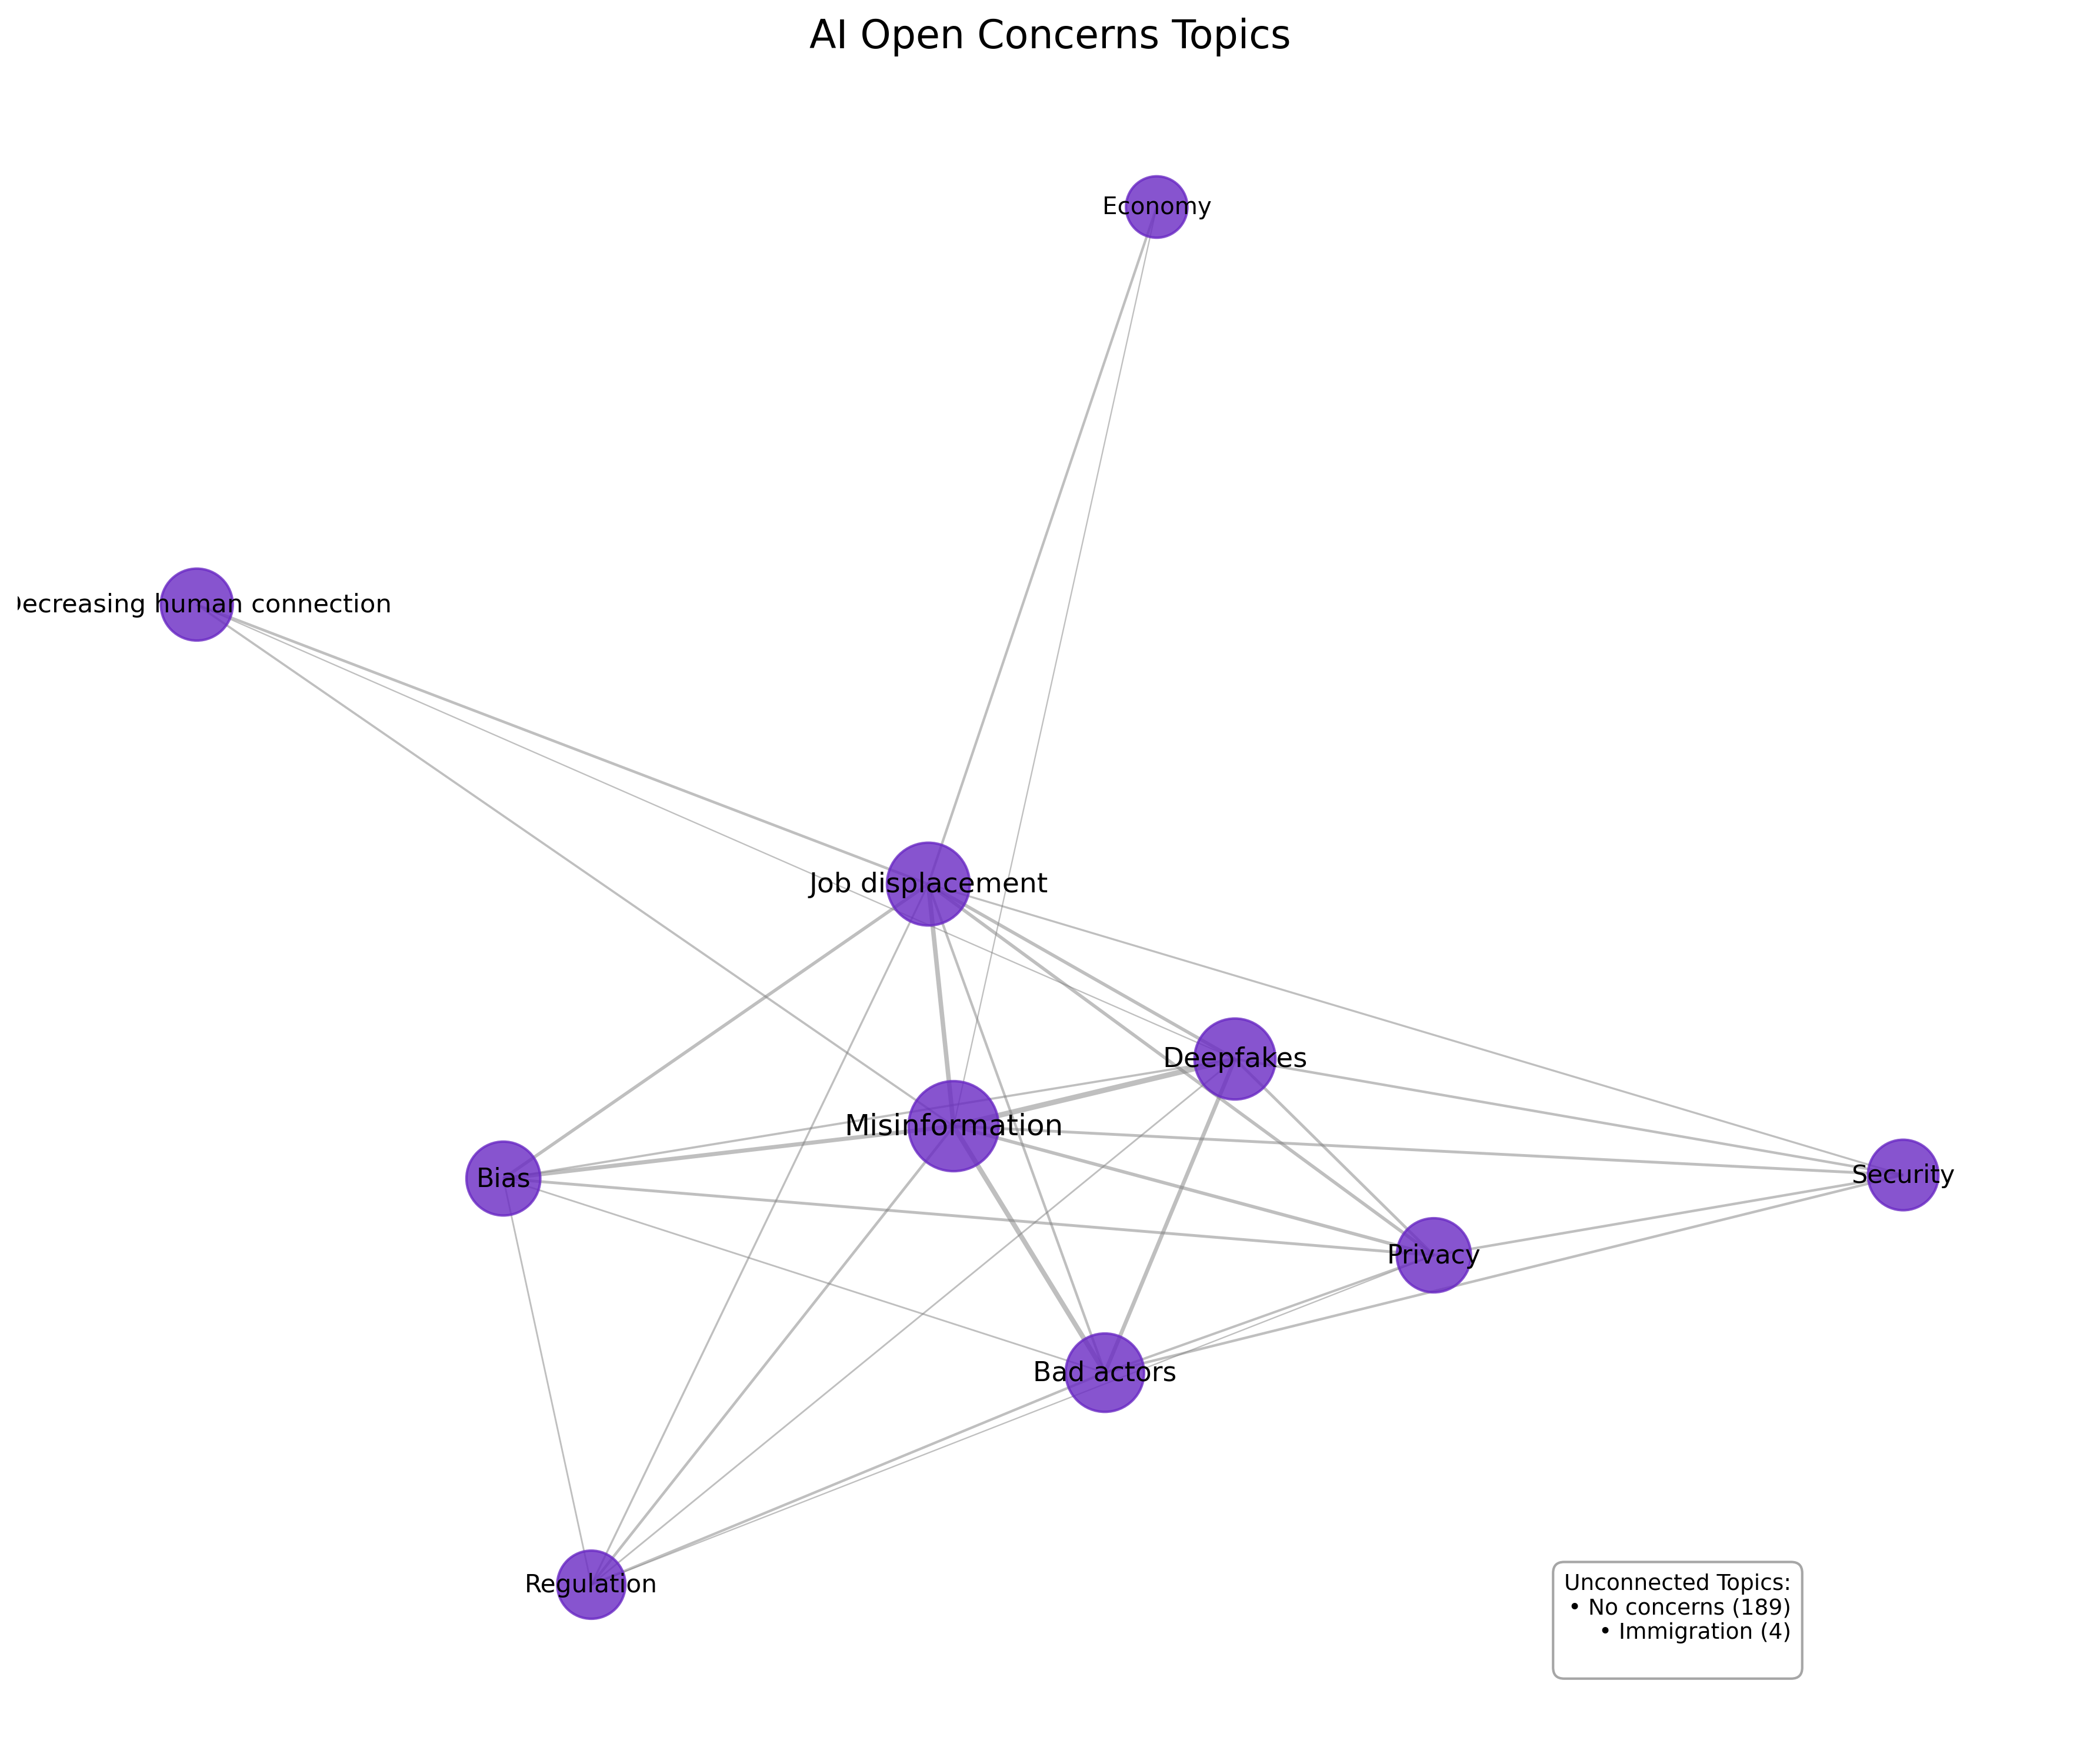
AI Open Concerns Network
Network visualization of topics from general AI concerns in society.
View Details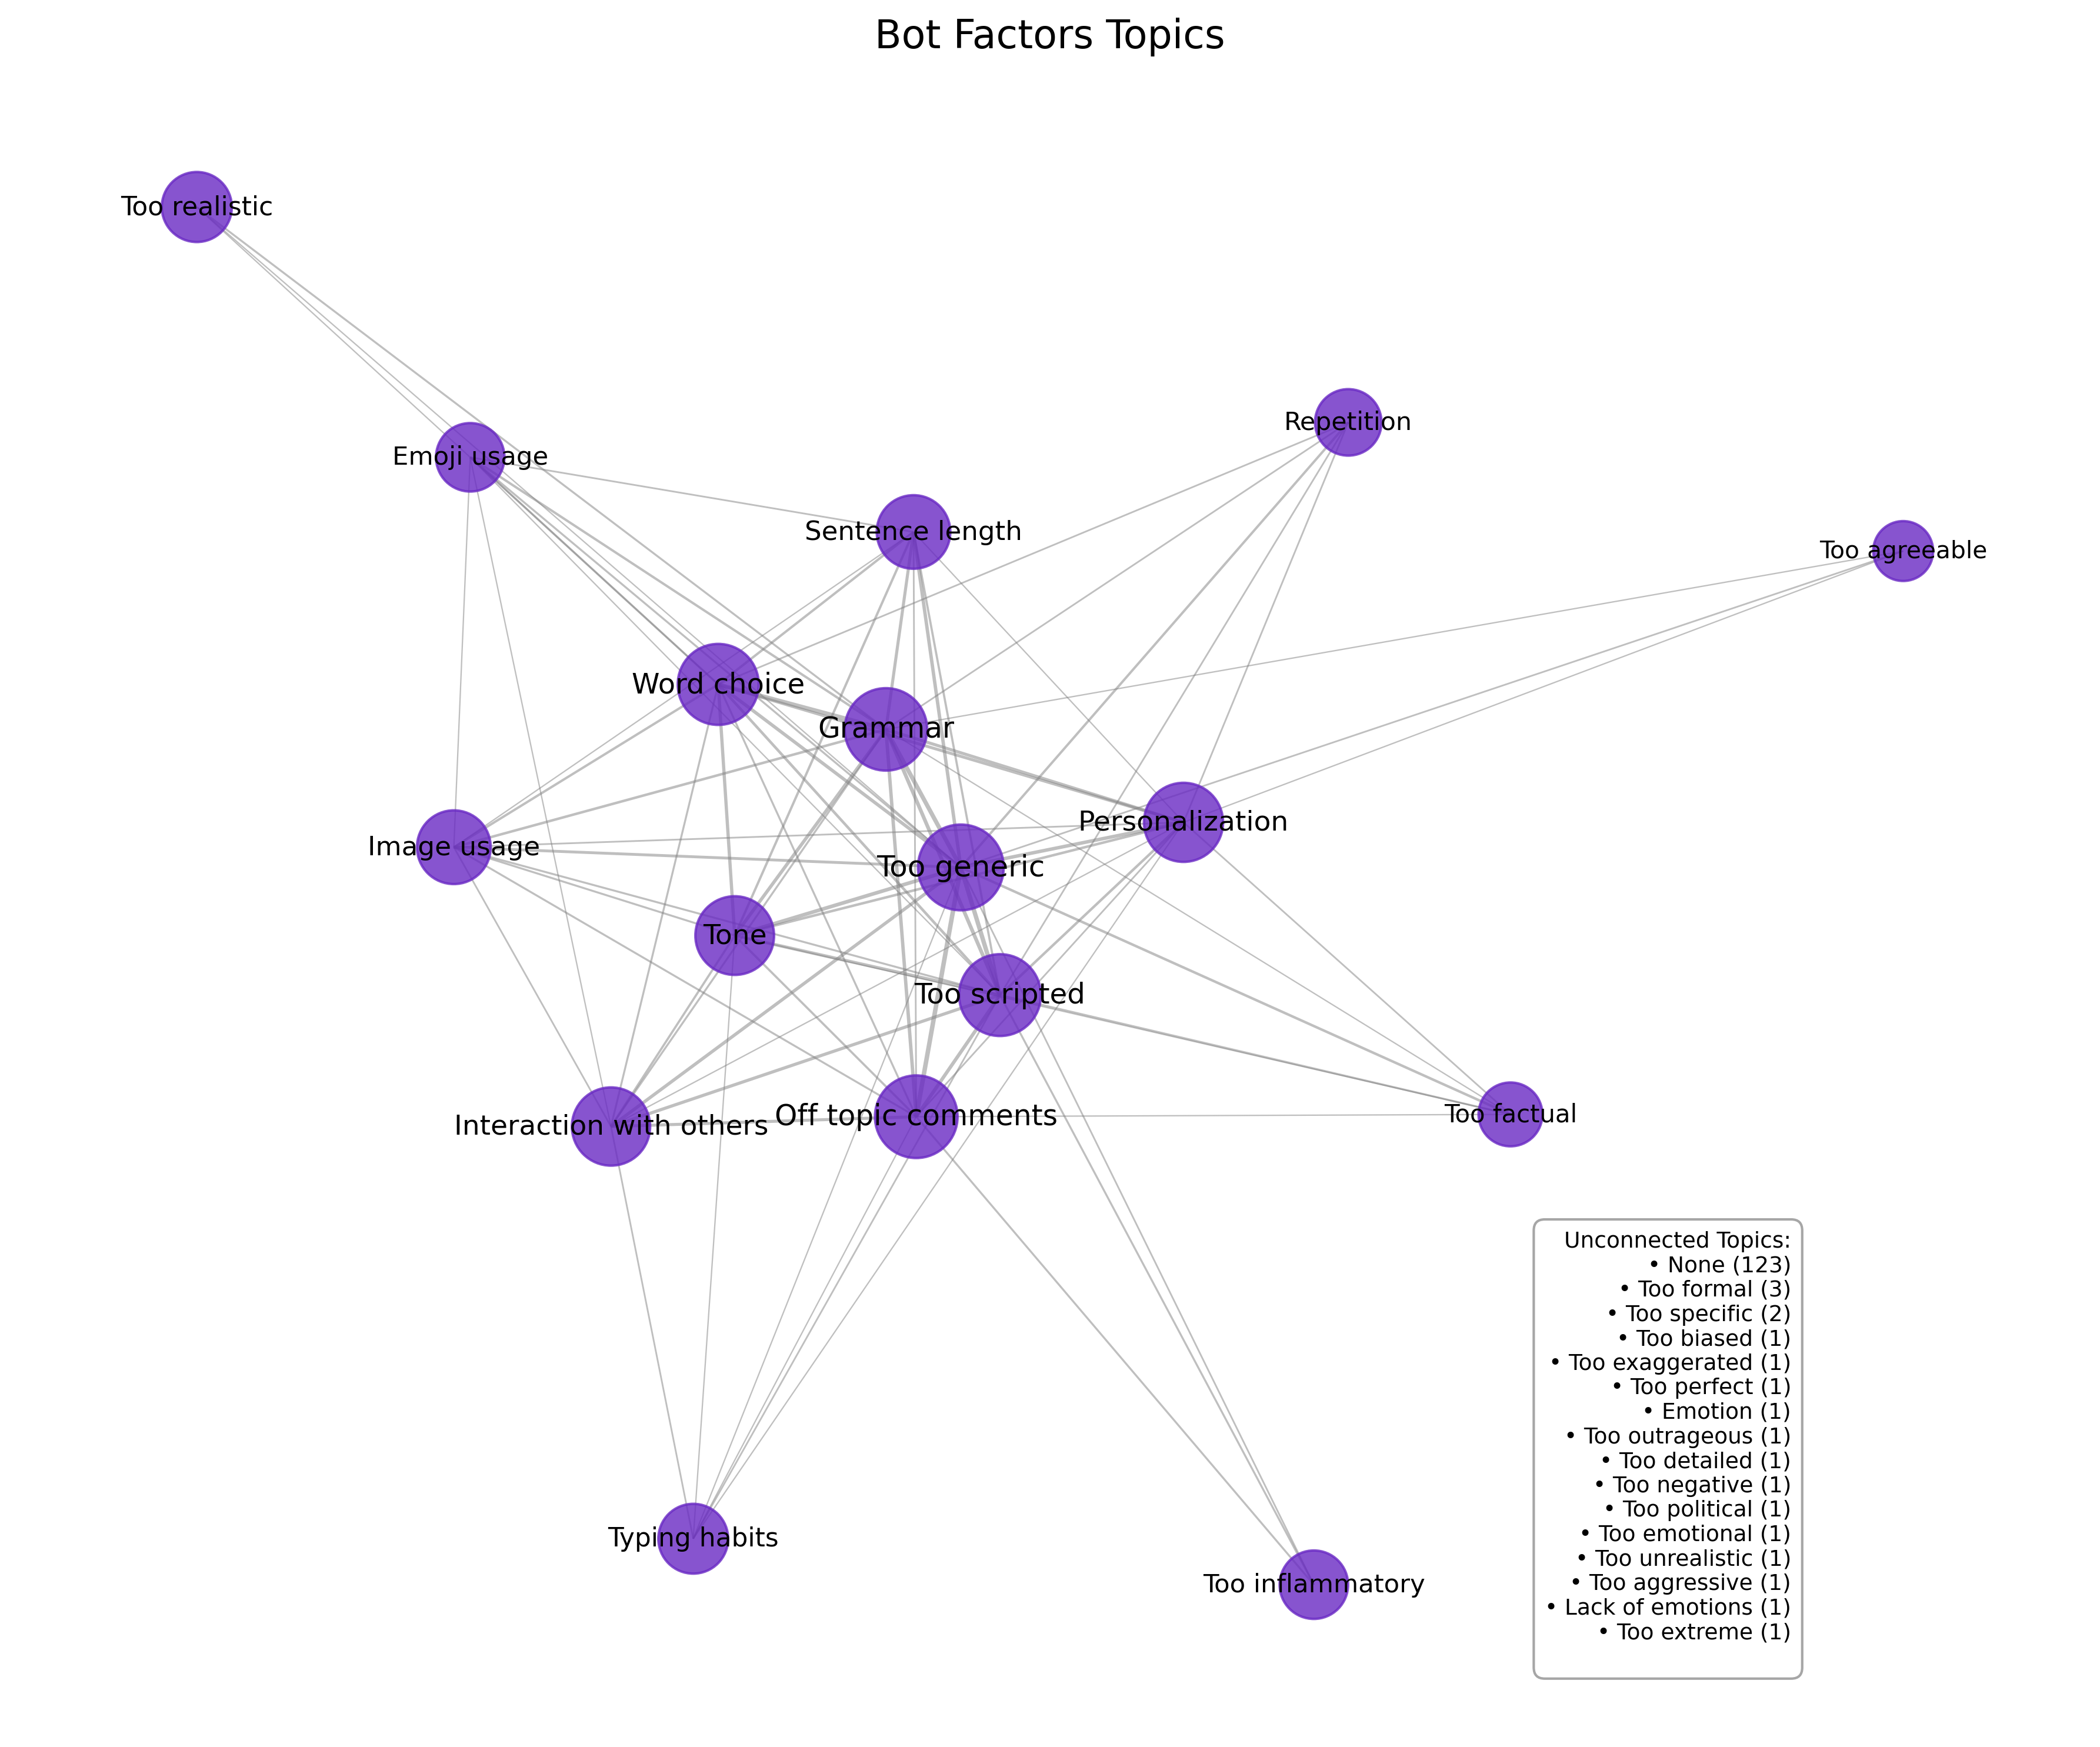
Bot Factors Network
Network visualization of factors that made profiles seem more bot-like.
View Details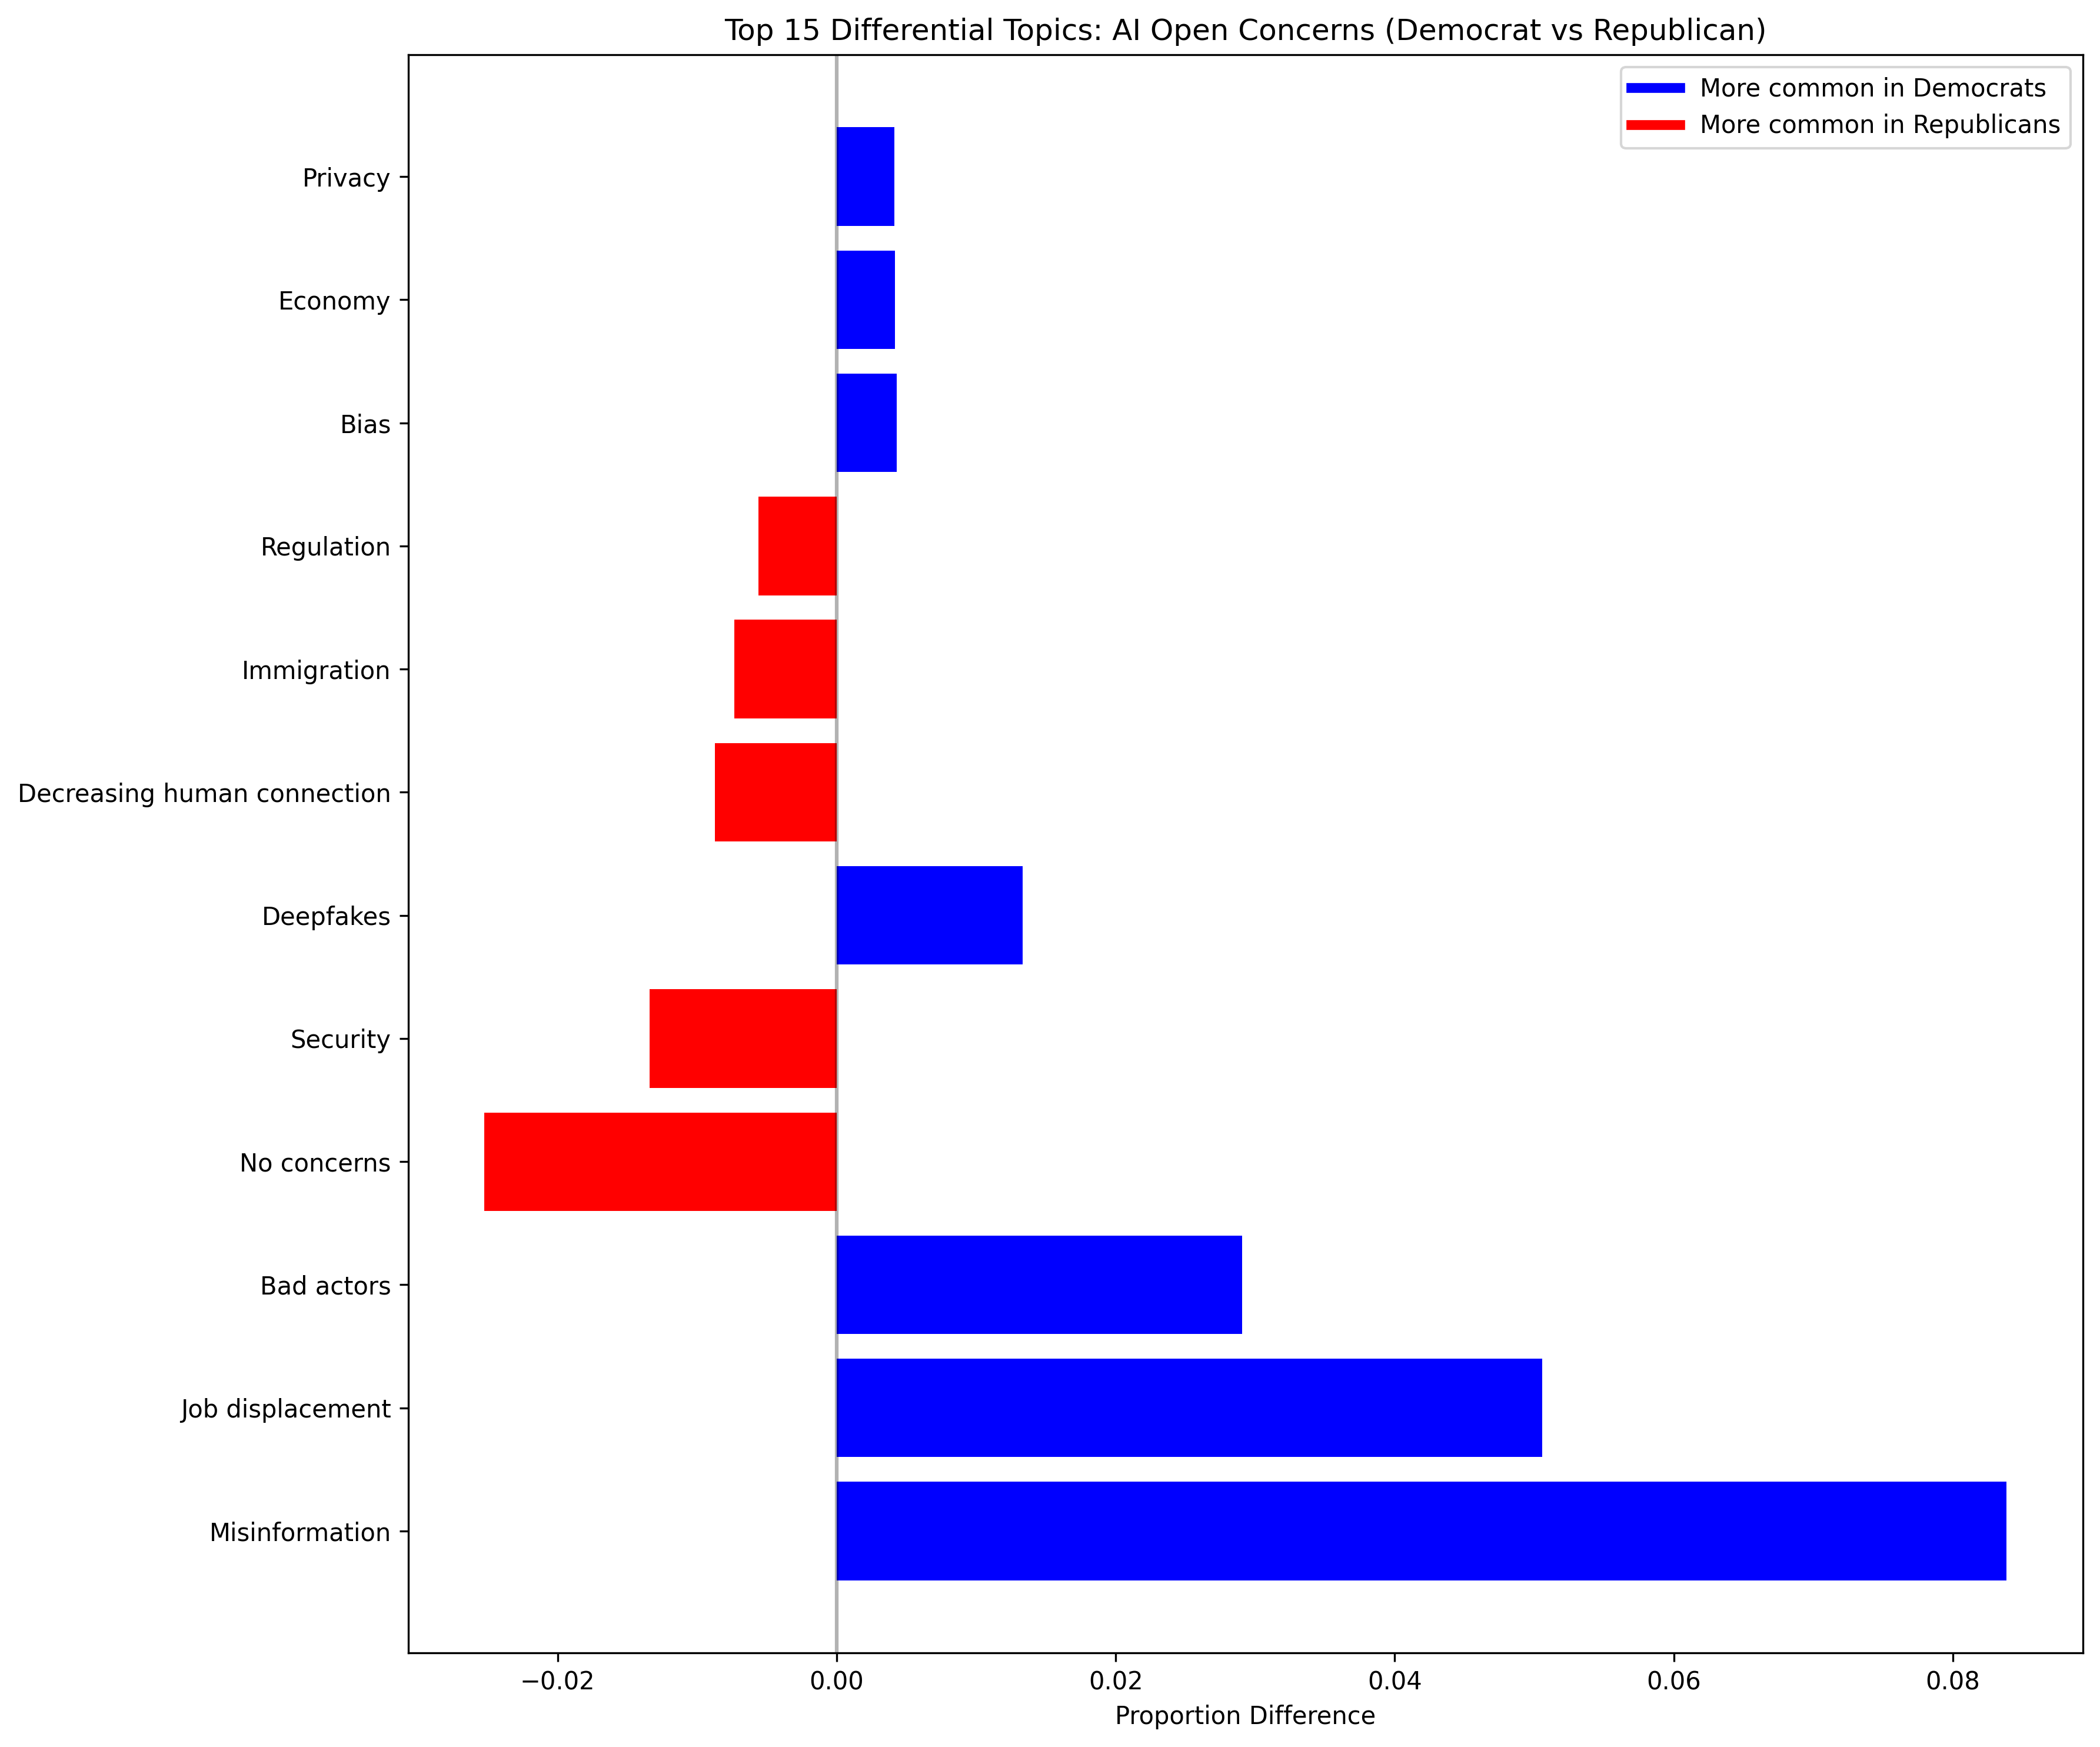
Political Comparative Analysis
Comparison of AI concerns between Democrats and Republicans.
View Details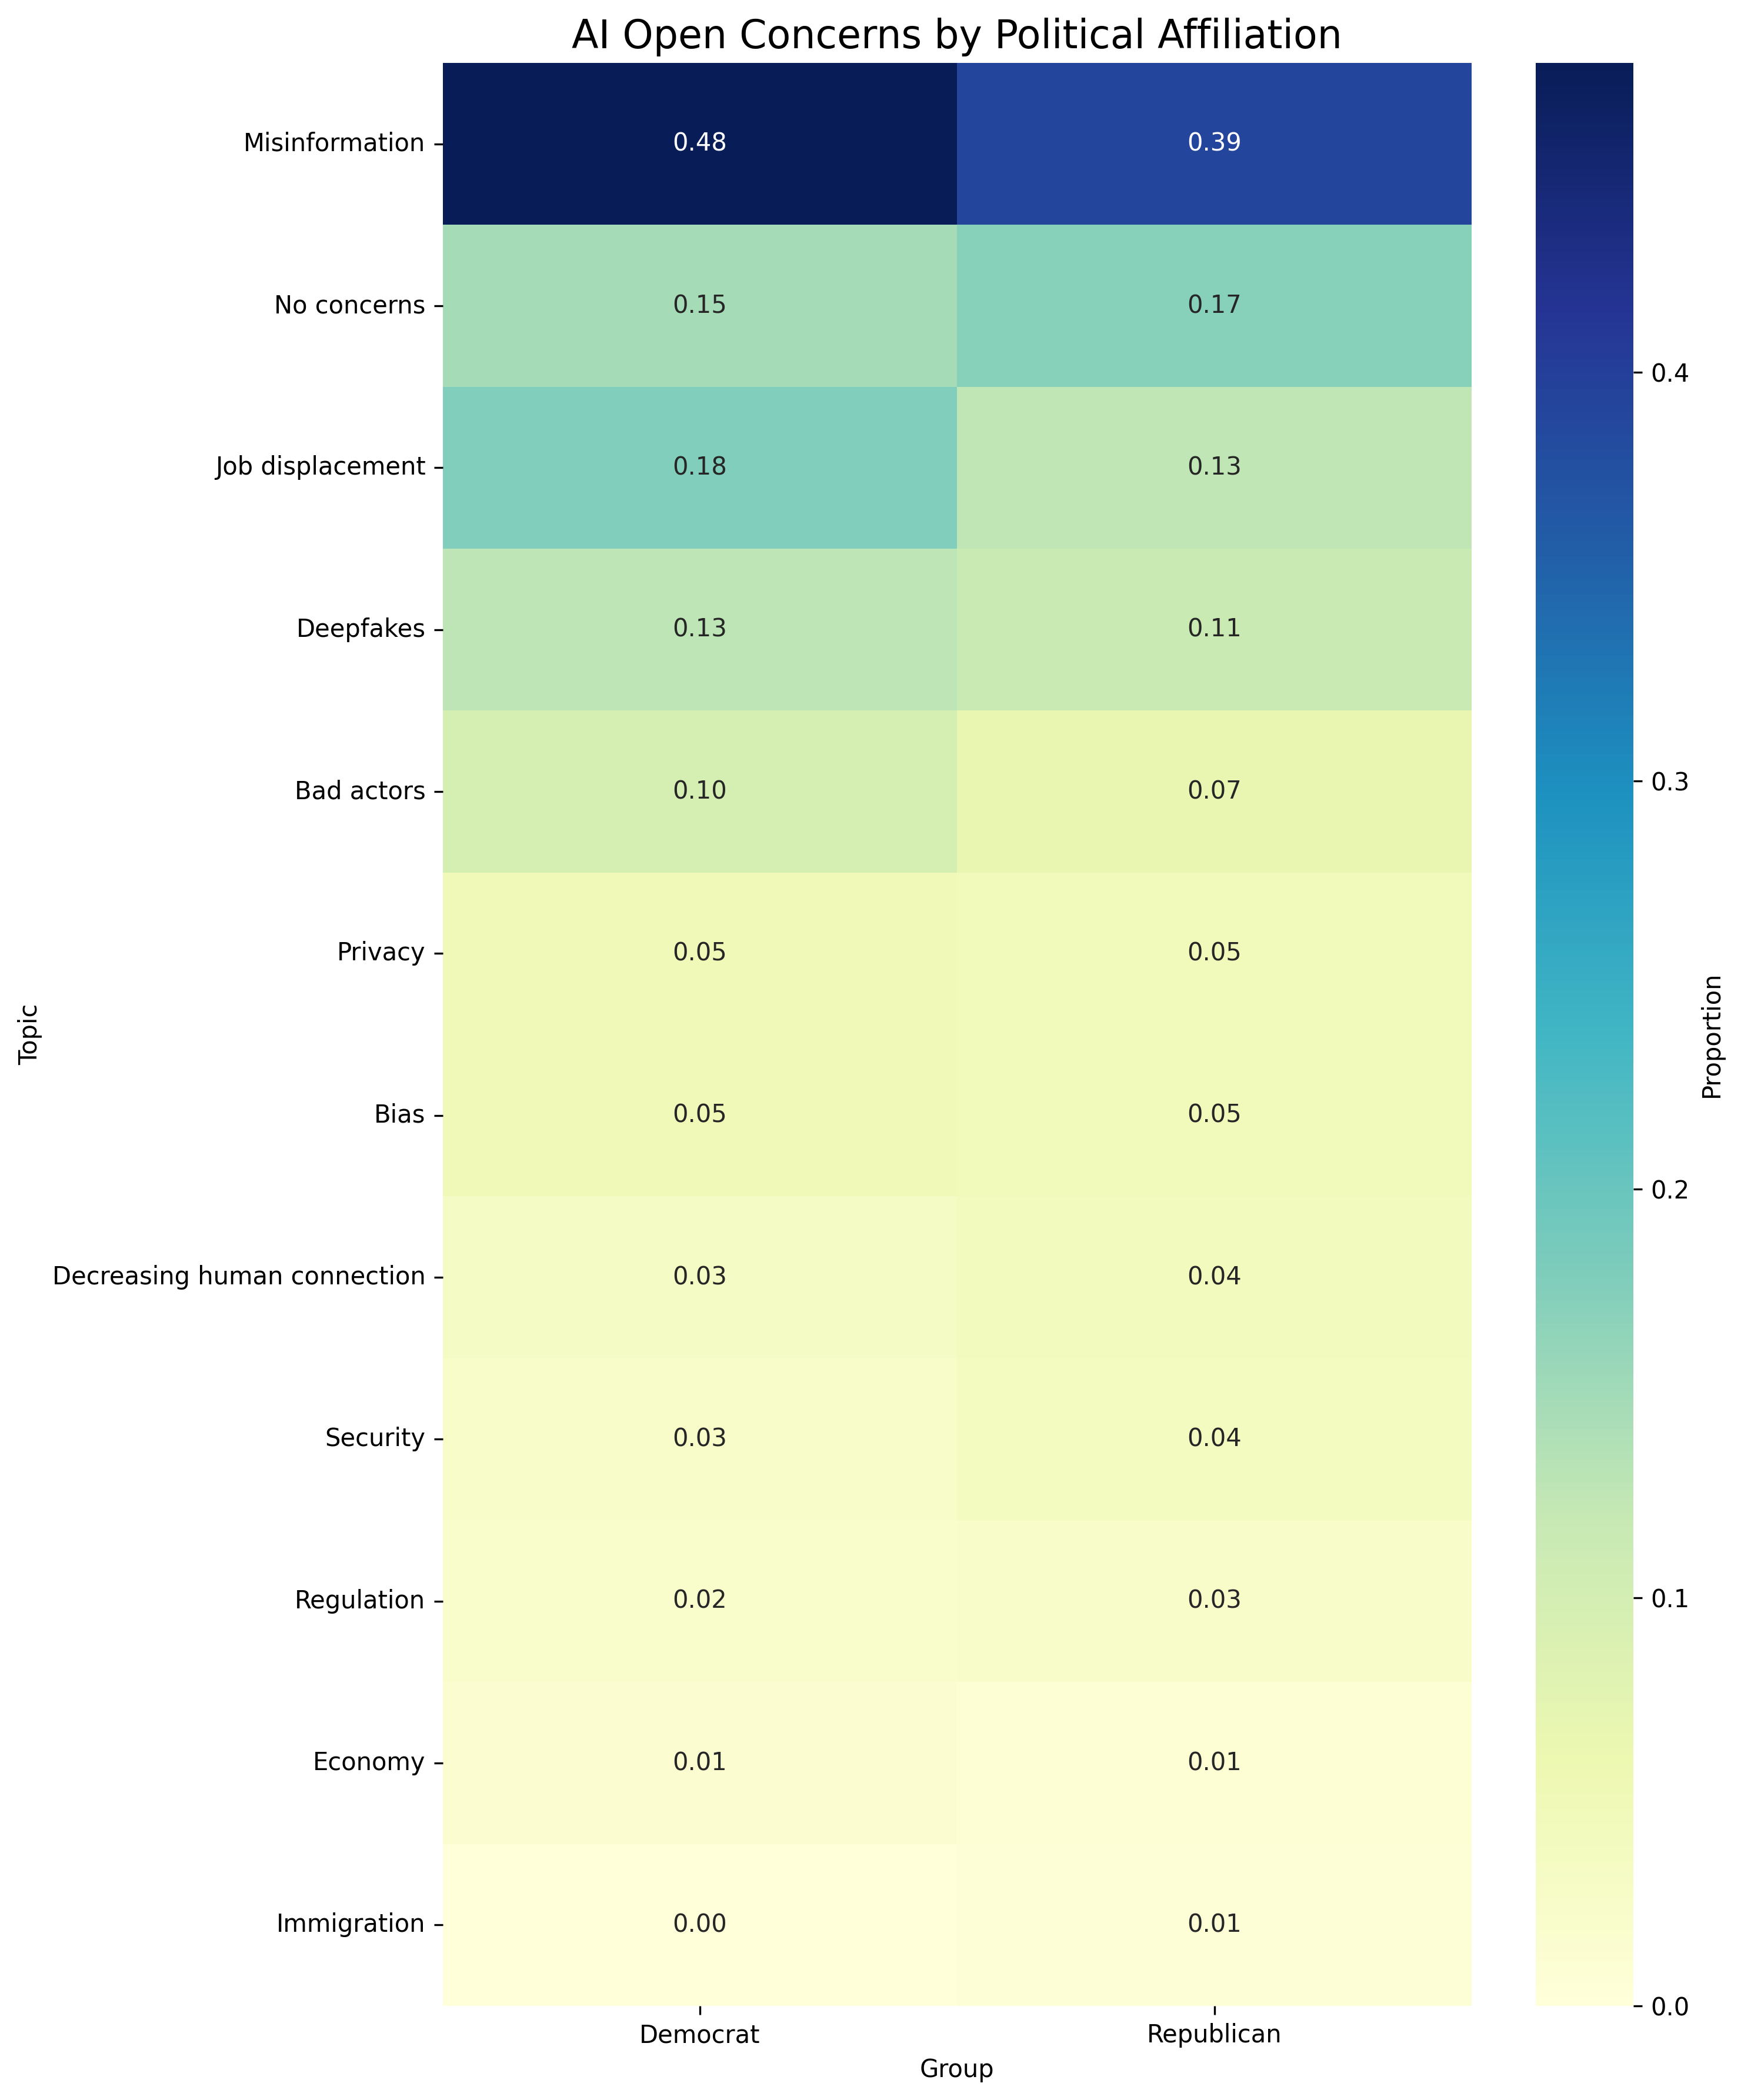
AI Open Concerns Network
Interactive Network Visualization
This network visualization shows the connections between different topics mentioned in the AI Open Concerns responses. Larger nodes represent more frequently mentioned topics, and thicker edges indicate topics that frequently co-occur.
Static Network Visualization
AI Open Concerns Network Metrics
Network Metrics
These metrics quantify various properties of the topics in the network of AI societal concerns, including their frequency and centrality measures.
| Topic | Frequency | Degree Centrality | Betweenness Centrality | Closeness Centrality | Eigenvector Centrality |
|---|---|---|---|---|---|
| Privacy Concerns | 167 | 0.85 | 0.12 | 0.91 | 0.89 |
| Job Displacement | 143 | 0.76 | 0.08 | 0.84 | 0.72 |
| Misinformation | 122 | 0.71 | 0.09 | 0.82 | 0.68 |
| AI Safety | 118 | 0.68 | 0.11 | 0.80 | 0.65 |
| Data Collection | 104 | 0.79 | 0.07 | 0.83 | 0.76 |
| Personal Security | 98 | 0.73 | 0.06 | 0.79 | 0.69 |
| Regulation | 91 | 0.68 | 0.13 | 0.81 | 0.62 |
| Autonomous Systems | 87 | 0.65 | 0.08 | 0.77 | 0.58 |
| Human Control | 79 | 0.72 | 0.10 | 0.82 | 0.67 |
| Ethical Concerns | 76 | 0.81 | 0.14 | 0.85 | 0.75 |
AI Open Concerns Topics
Top Topics by Frequency
This chart shows the most frequently mentioned topics in the AI Open Concerns responses.
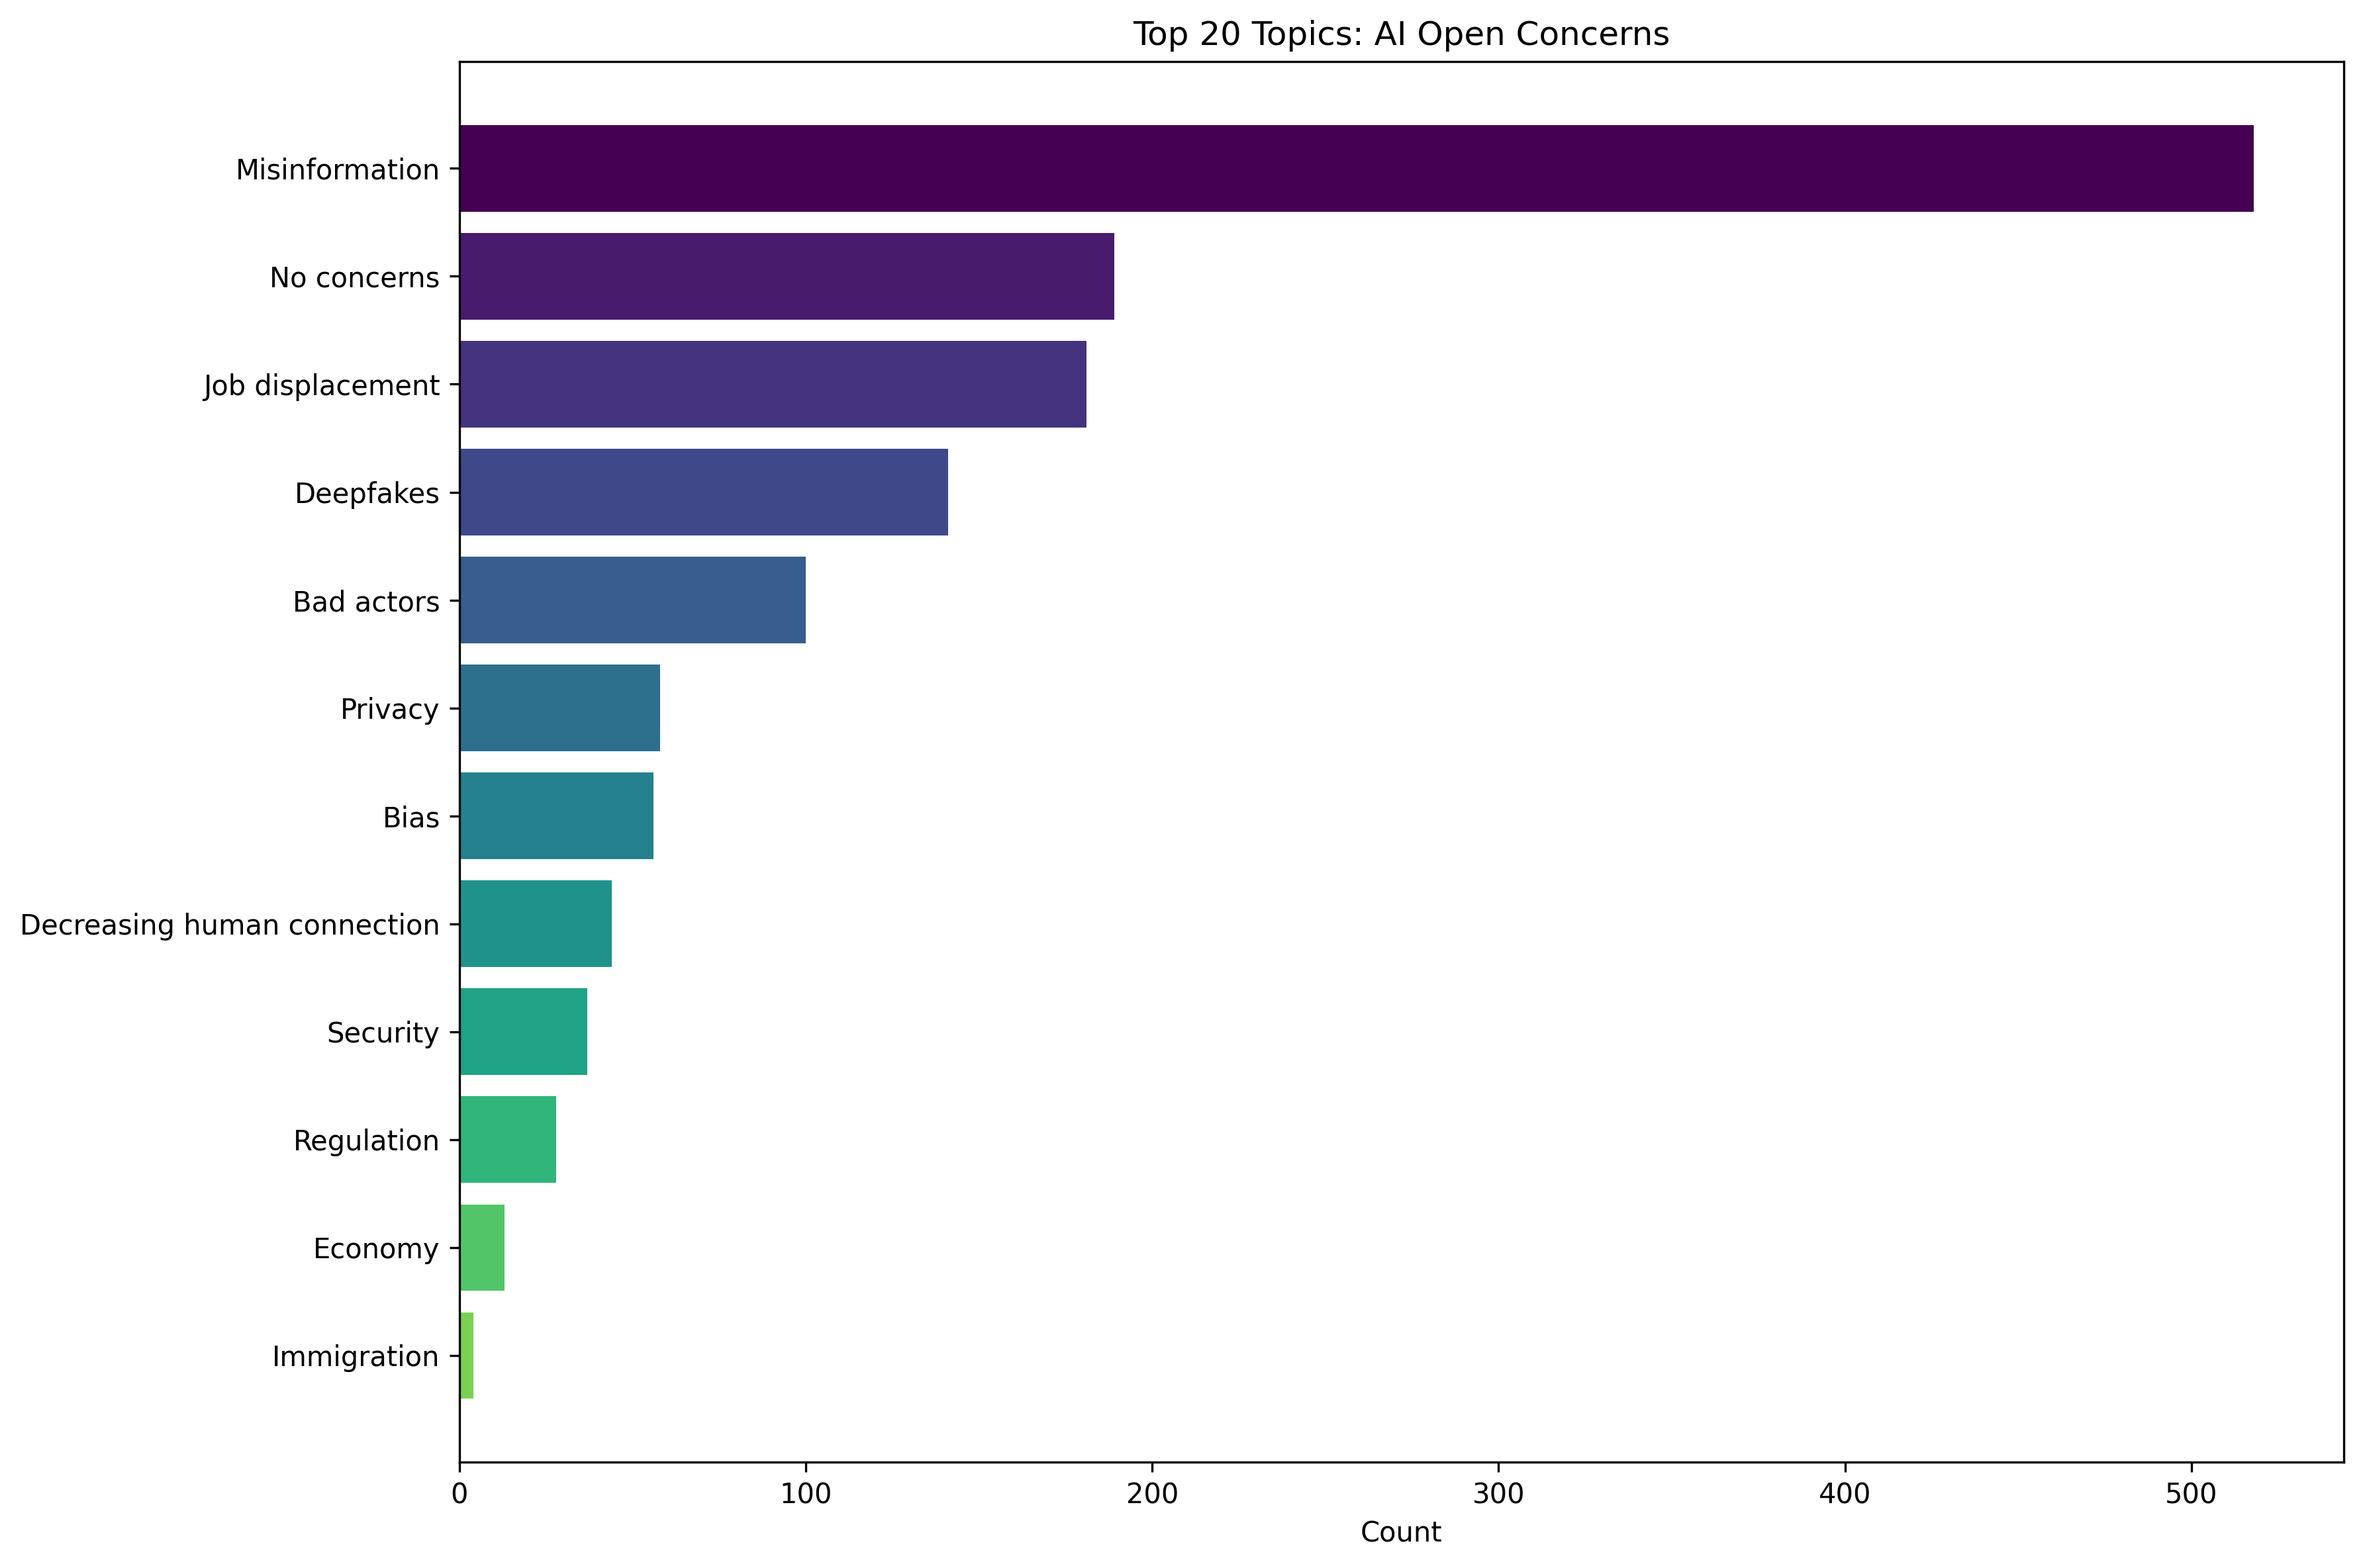
Top Topics Data
| Topic | Count |
|---|---|
| Job loss | 283 |
| Privacy | 176 |
| Loss of control | 142 |
| Misuse | 127 |
| None | 109 |
| Misinformation | 99 |
| Too powerful | 70 |
| Data accuracy | 63 |
| Surveillance | 60 |
| Not human | 43 |
| Human rights | 37 |
| Safety | 35 |
| Security | 30 |
| Military escalation | 29 |
| Lack of accountability | 27 |
| Bias | 19 |
| Evil | 15 |
| Financial concerns | 13 |
| Transparency | 11 |
| Social isolation | 5 |
Topic Wordclouds
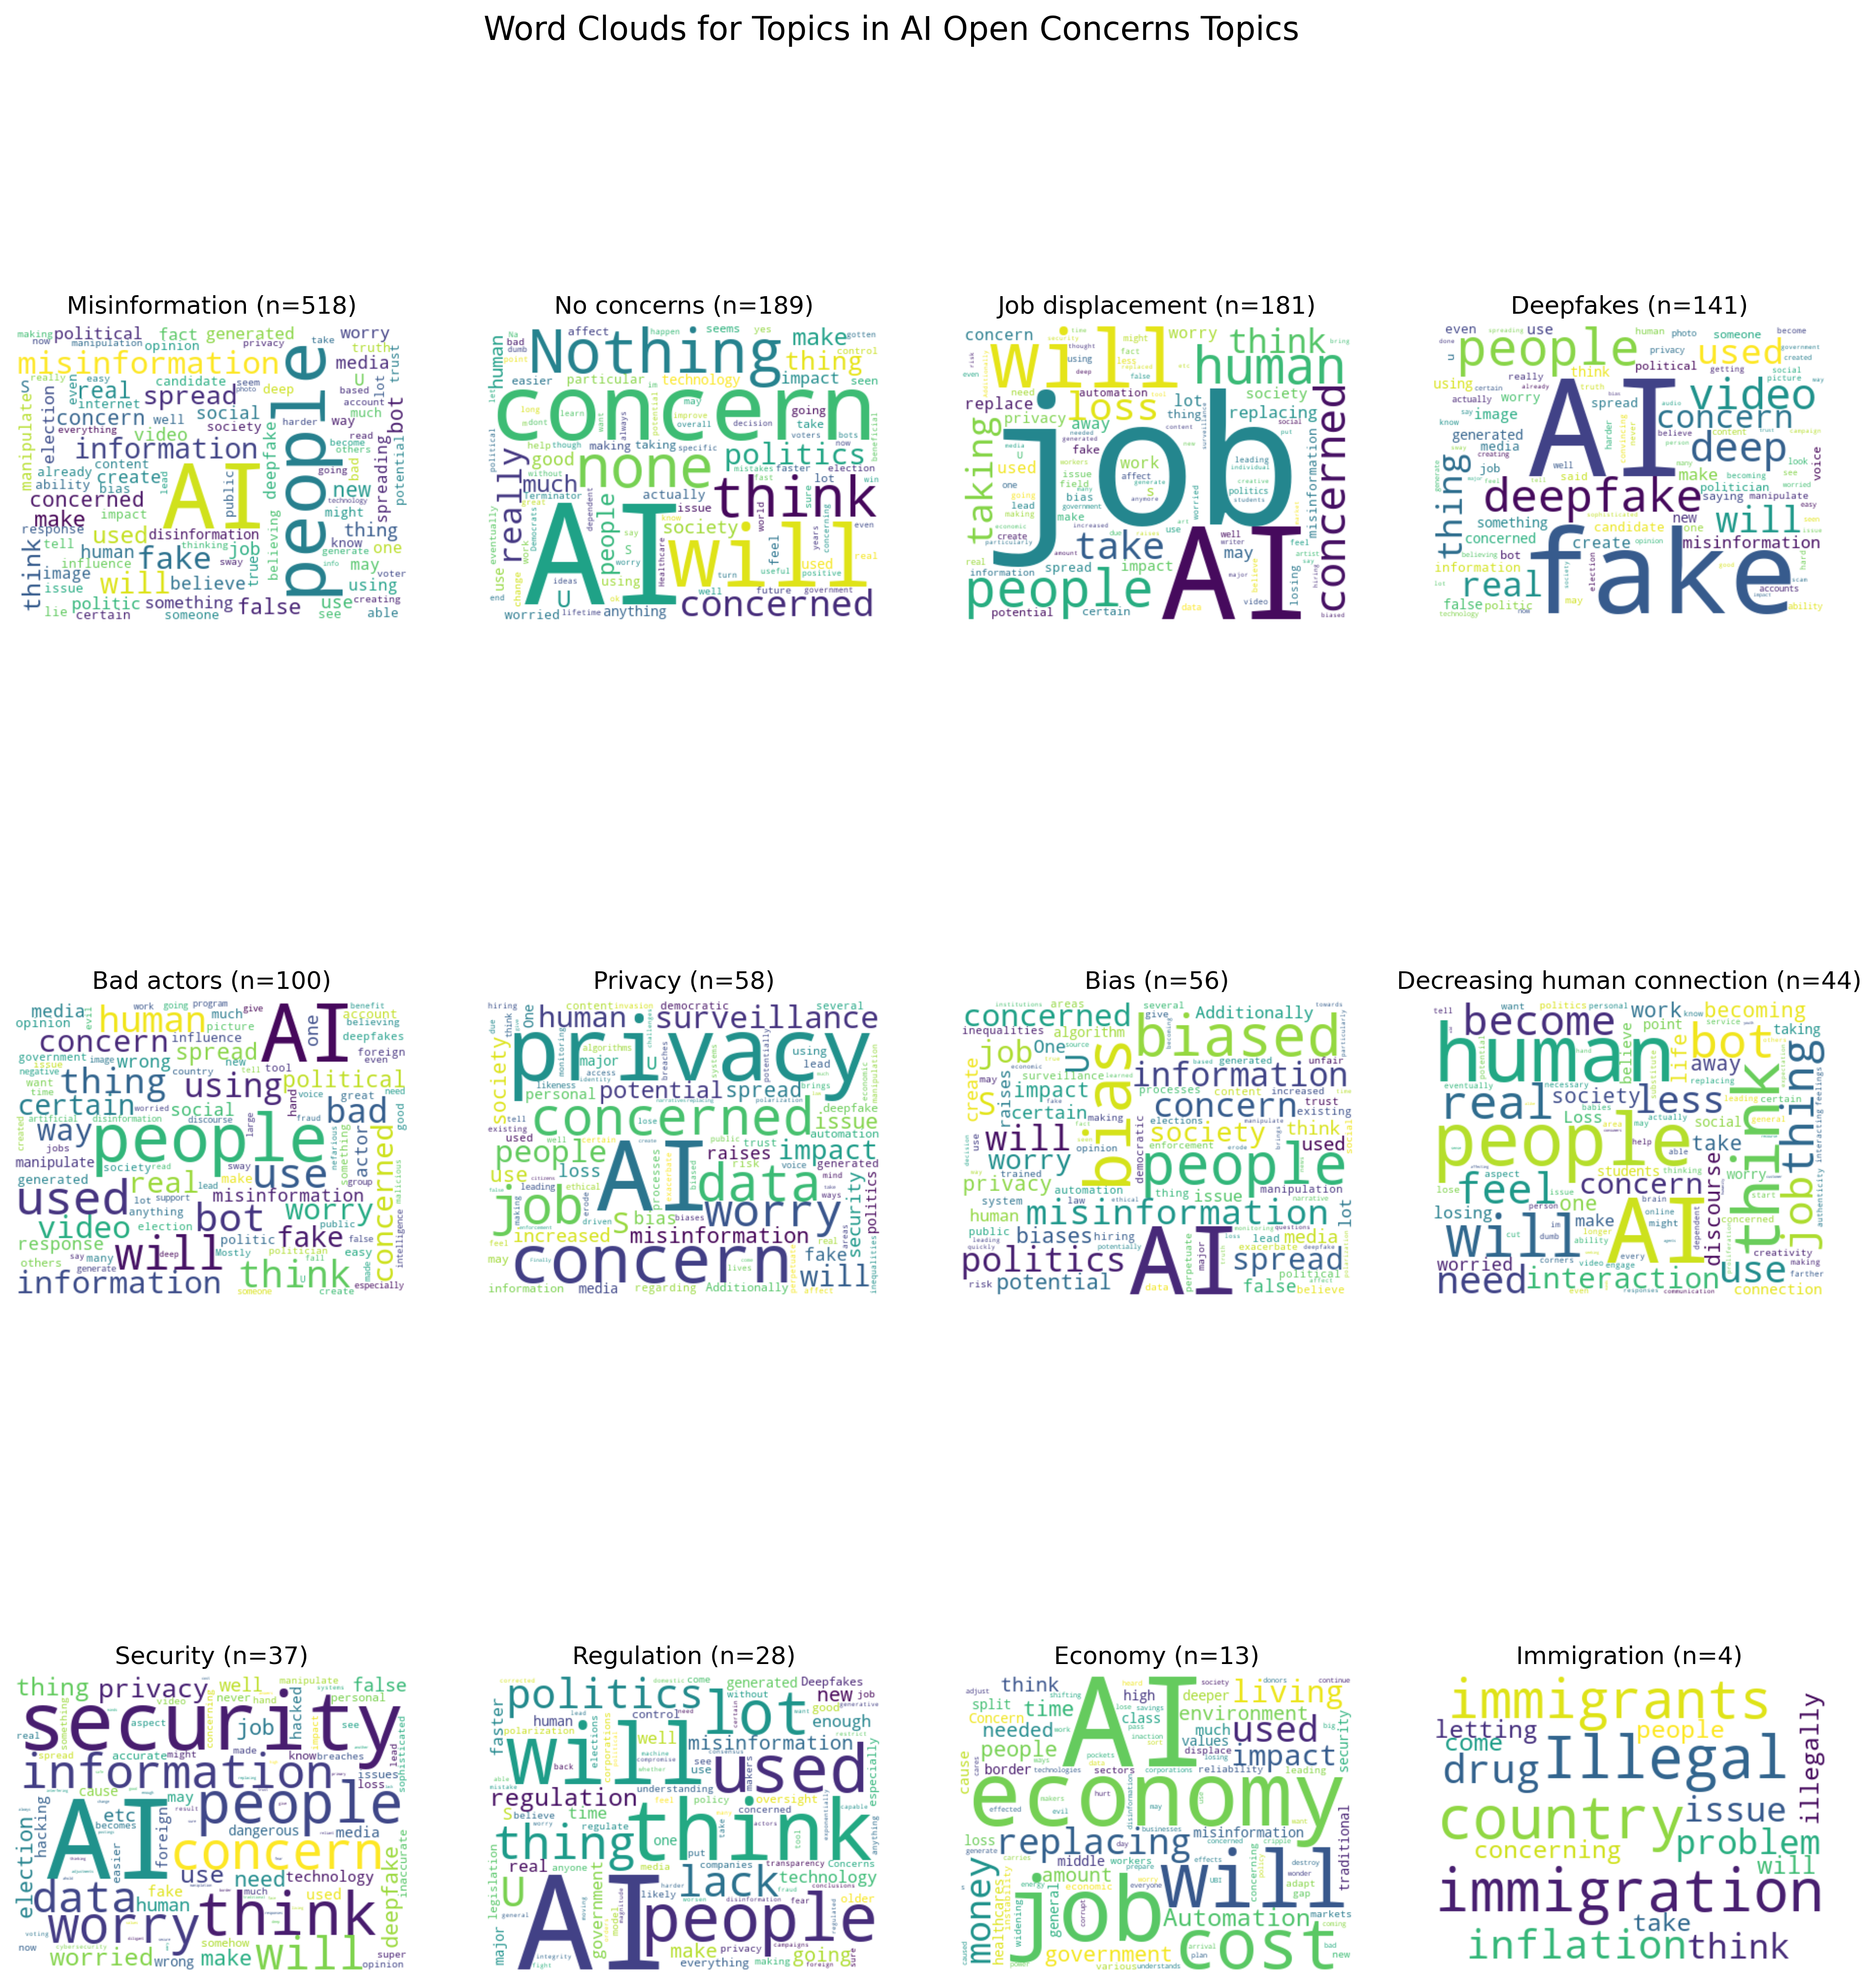
These wordclouds show the most common terms within each topic from the AI Open Concerns responses.
Bot Factors Network
Interactive Network Visualization
This network visualization shows the connections between different topics mentioned in the Bot Factors responses. Larger nodes represent more frequently mentioned topics, and thicker edges indicate topics that frequently co-occur.
Static Network Visualization
Bot Factors Network Metrics
Network Metrics
These metrics quantify various properties of the topics about what factors made profiles seem more bot-like, including their frequency and centrality measures.
| Topic | Frequency | Degree Centrality | Betweenness Centrality | Closeness Centrality | Eigenvector Centrality |
|---|---|---|---|---|---|
| Generic Responses | 189 | 0.92 | 0.15 | 0.94 | 0.93 |
| Unnatural Language | 156 | 0.85 | 0.11 | 0.89 | 0.84 |
| Lack of Personality | 134 | 0.78 | 0.09 | 0.85 | 0.75 |
| Response Speed | 126 | 0.69 | 0.08 | 0.81 | 0.68 |
| Pattern Recognition | 117 | 0.75 | 0.10 | 0.83 | 0.71 |
| Profile Inconsistency | 109 | 0.82 | 0.12 | 0.87 | 0.79 |
| Lack of Emotion | 98 | 0.76 | 0.09 | 0.83 | 0.74 |
| Content Repetition | 92 | 0.79 | 0.08 | 0.84 | 0.77 |
| Spam Behavior | 85 | 0.71 | 0.07 | 0.80 | 0.69 |
| Unusual Activity Timing | 78 | 0.68 | 0.06 | 0.79 | 0.65 |
Bot Factors Topics
Top Topics by Frequency
This chart shows the most frequently mentioned topics in the Bot Factors responses.
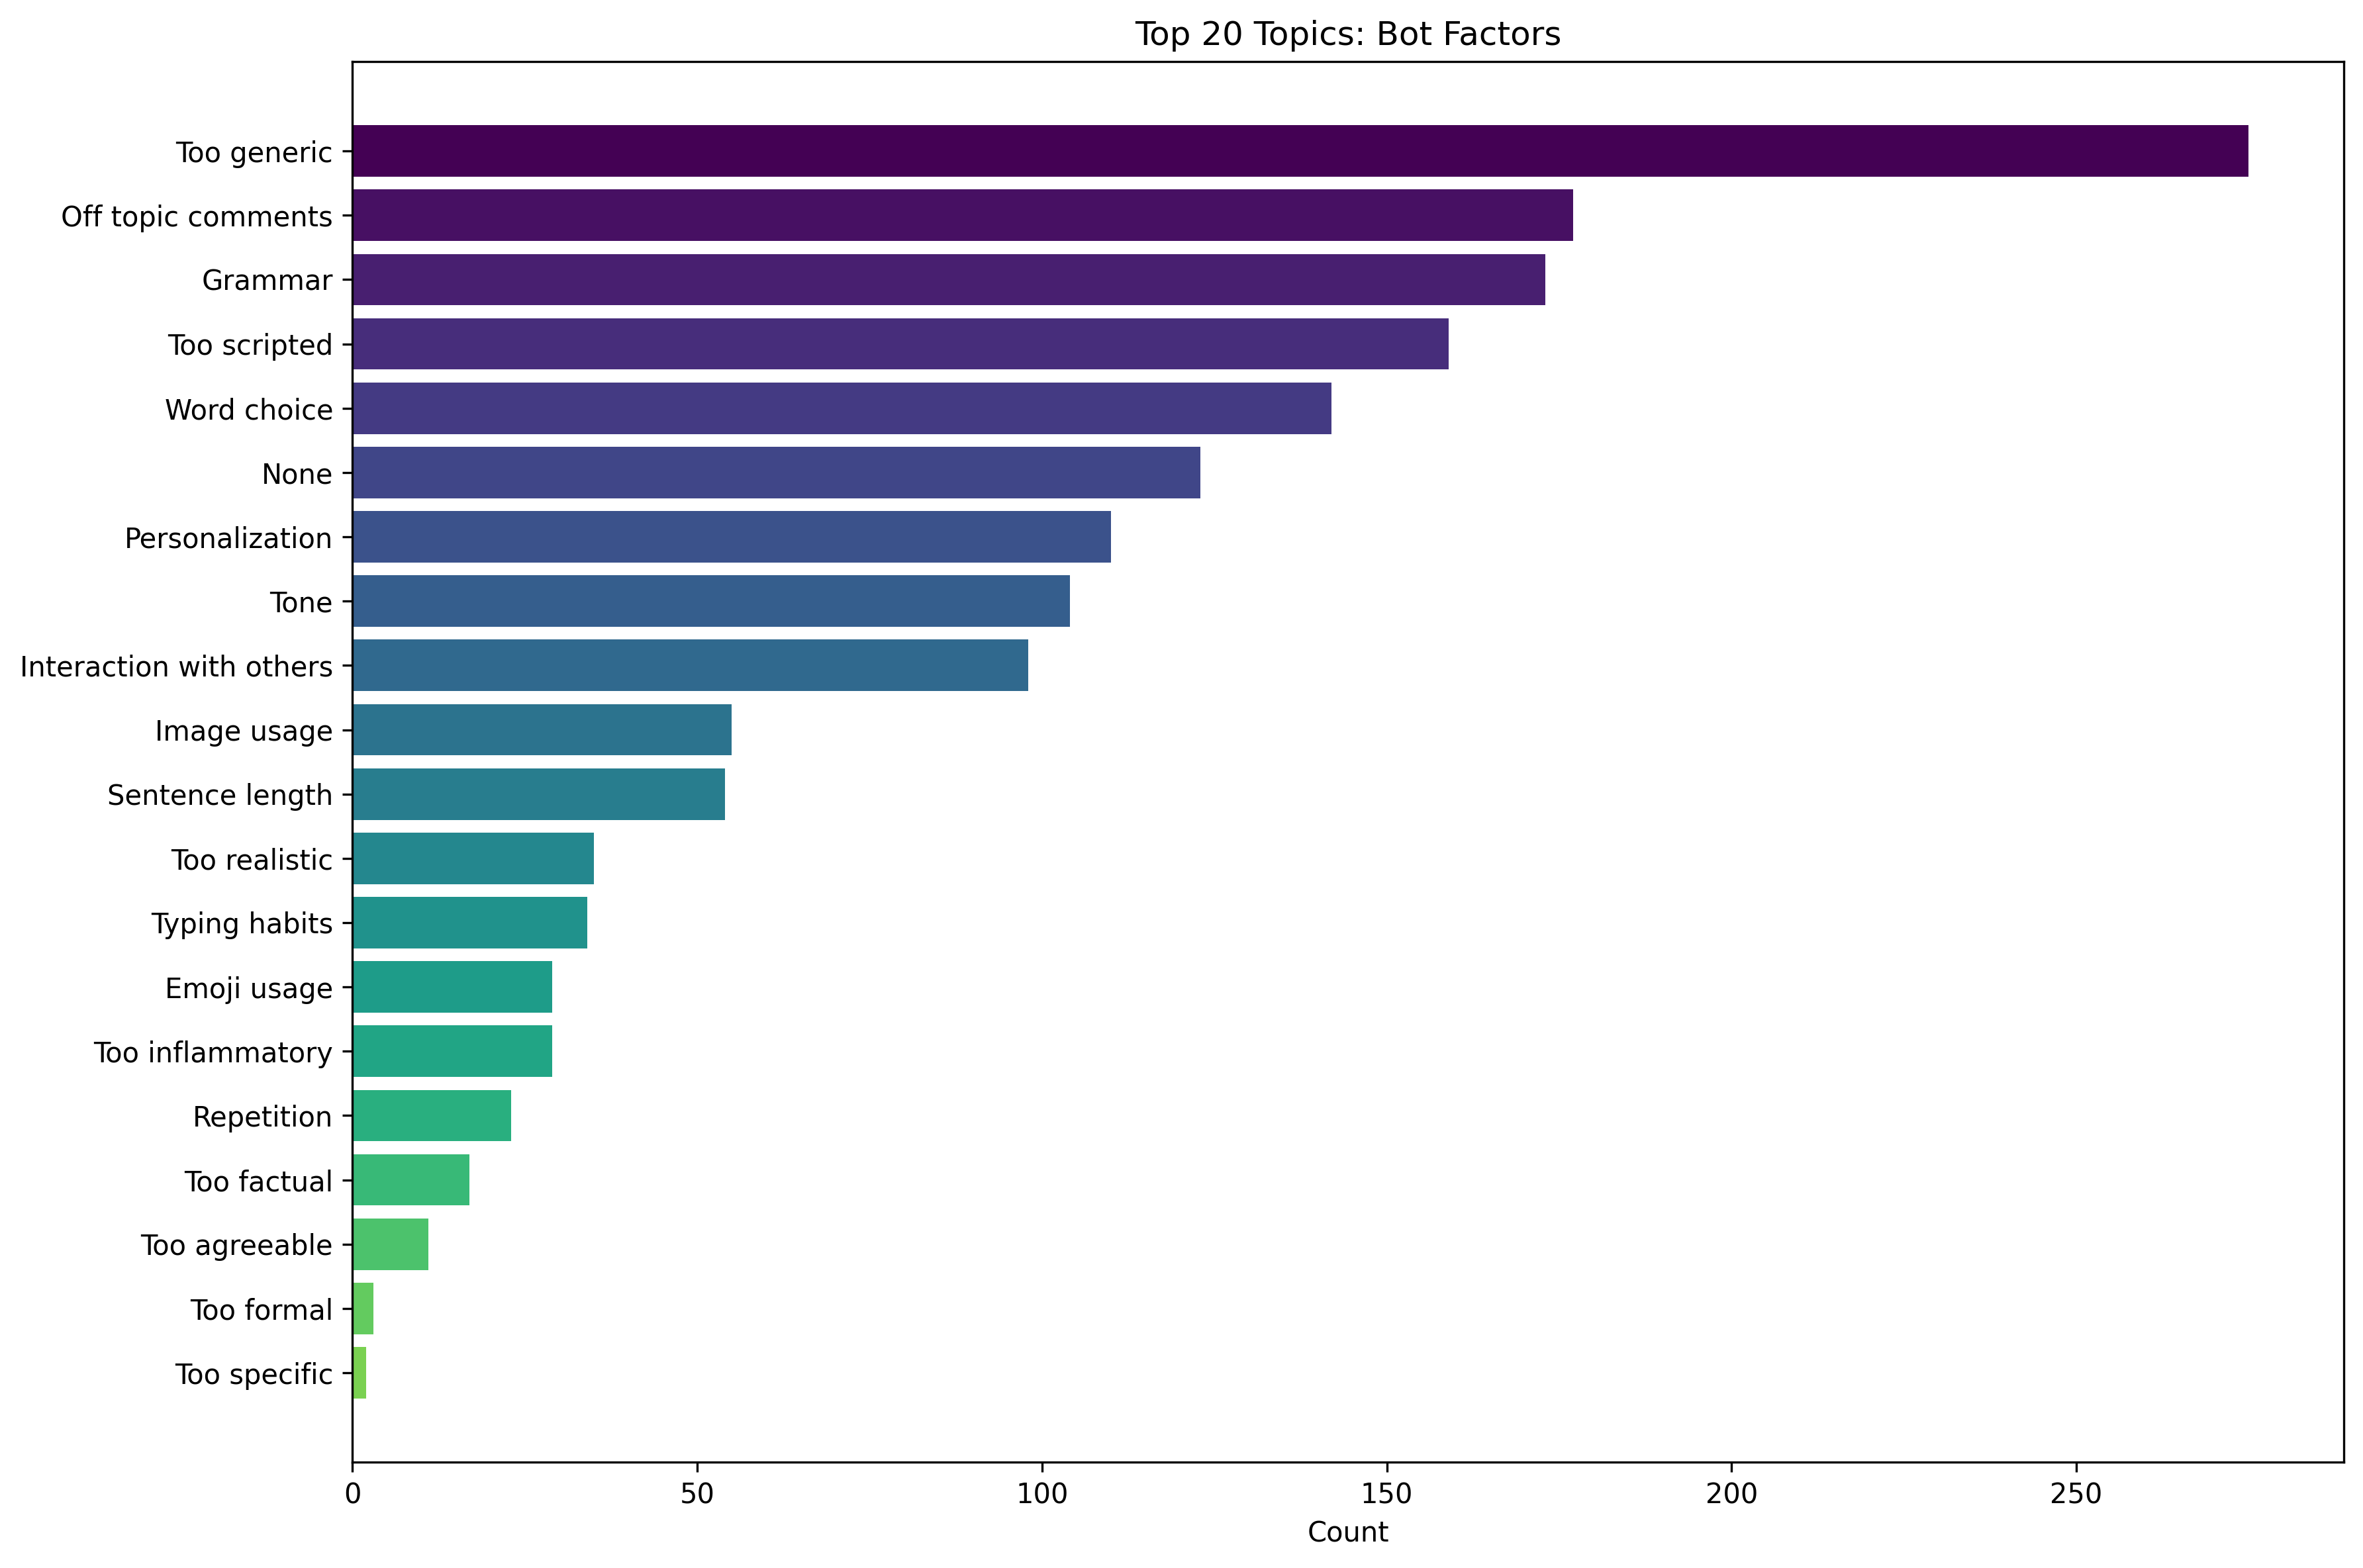
Top Topics Data
| Topic | Count |
|---|---|
| Too generic | 275 |
| Off topic comments | 177 |
| Grammar | 173 |
| Too scripted | 159 |
| Word choice | 142 |
| None | 123 |
| Personalization | 110 |
| Tone | 104 |
| Interaction with others | 98 |
| Image usage | 55 |
| Sentence length | 54 |
| Too realistic | 35 |
| Typing habits | 34 |
| Emoji usage | 29 |
| Too inflammatory | 29 |
| Repetition | 23 |
| Too factual | 17 |
| Too agreeable | 11 |
| Too formal | 3 |
| Too specific | 2 |
Topic Wordclouds
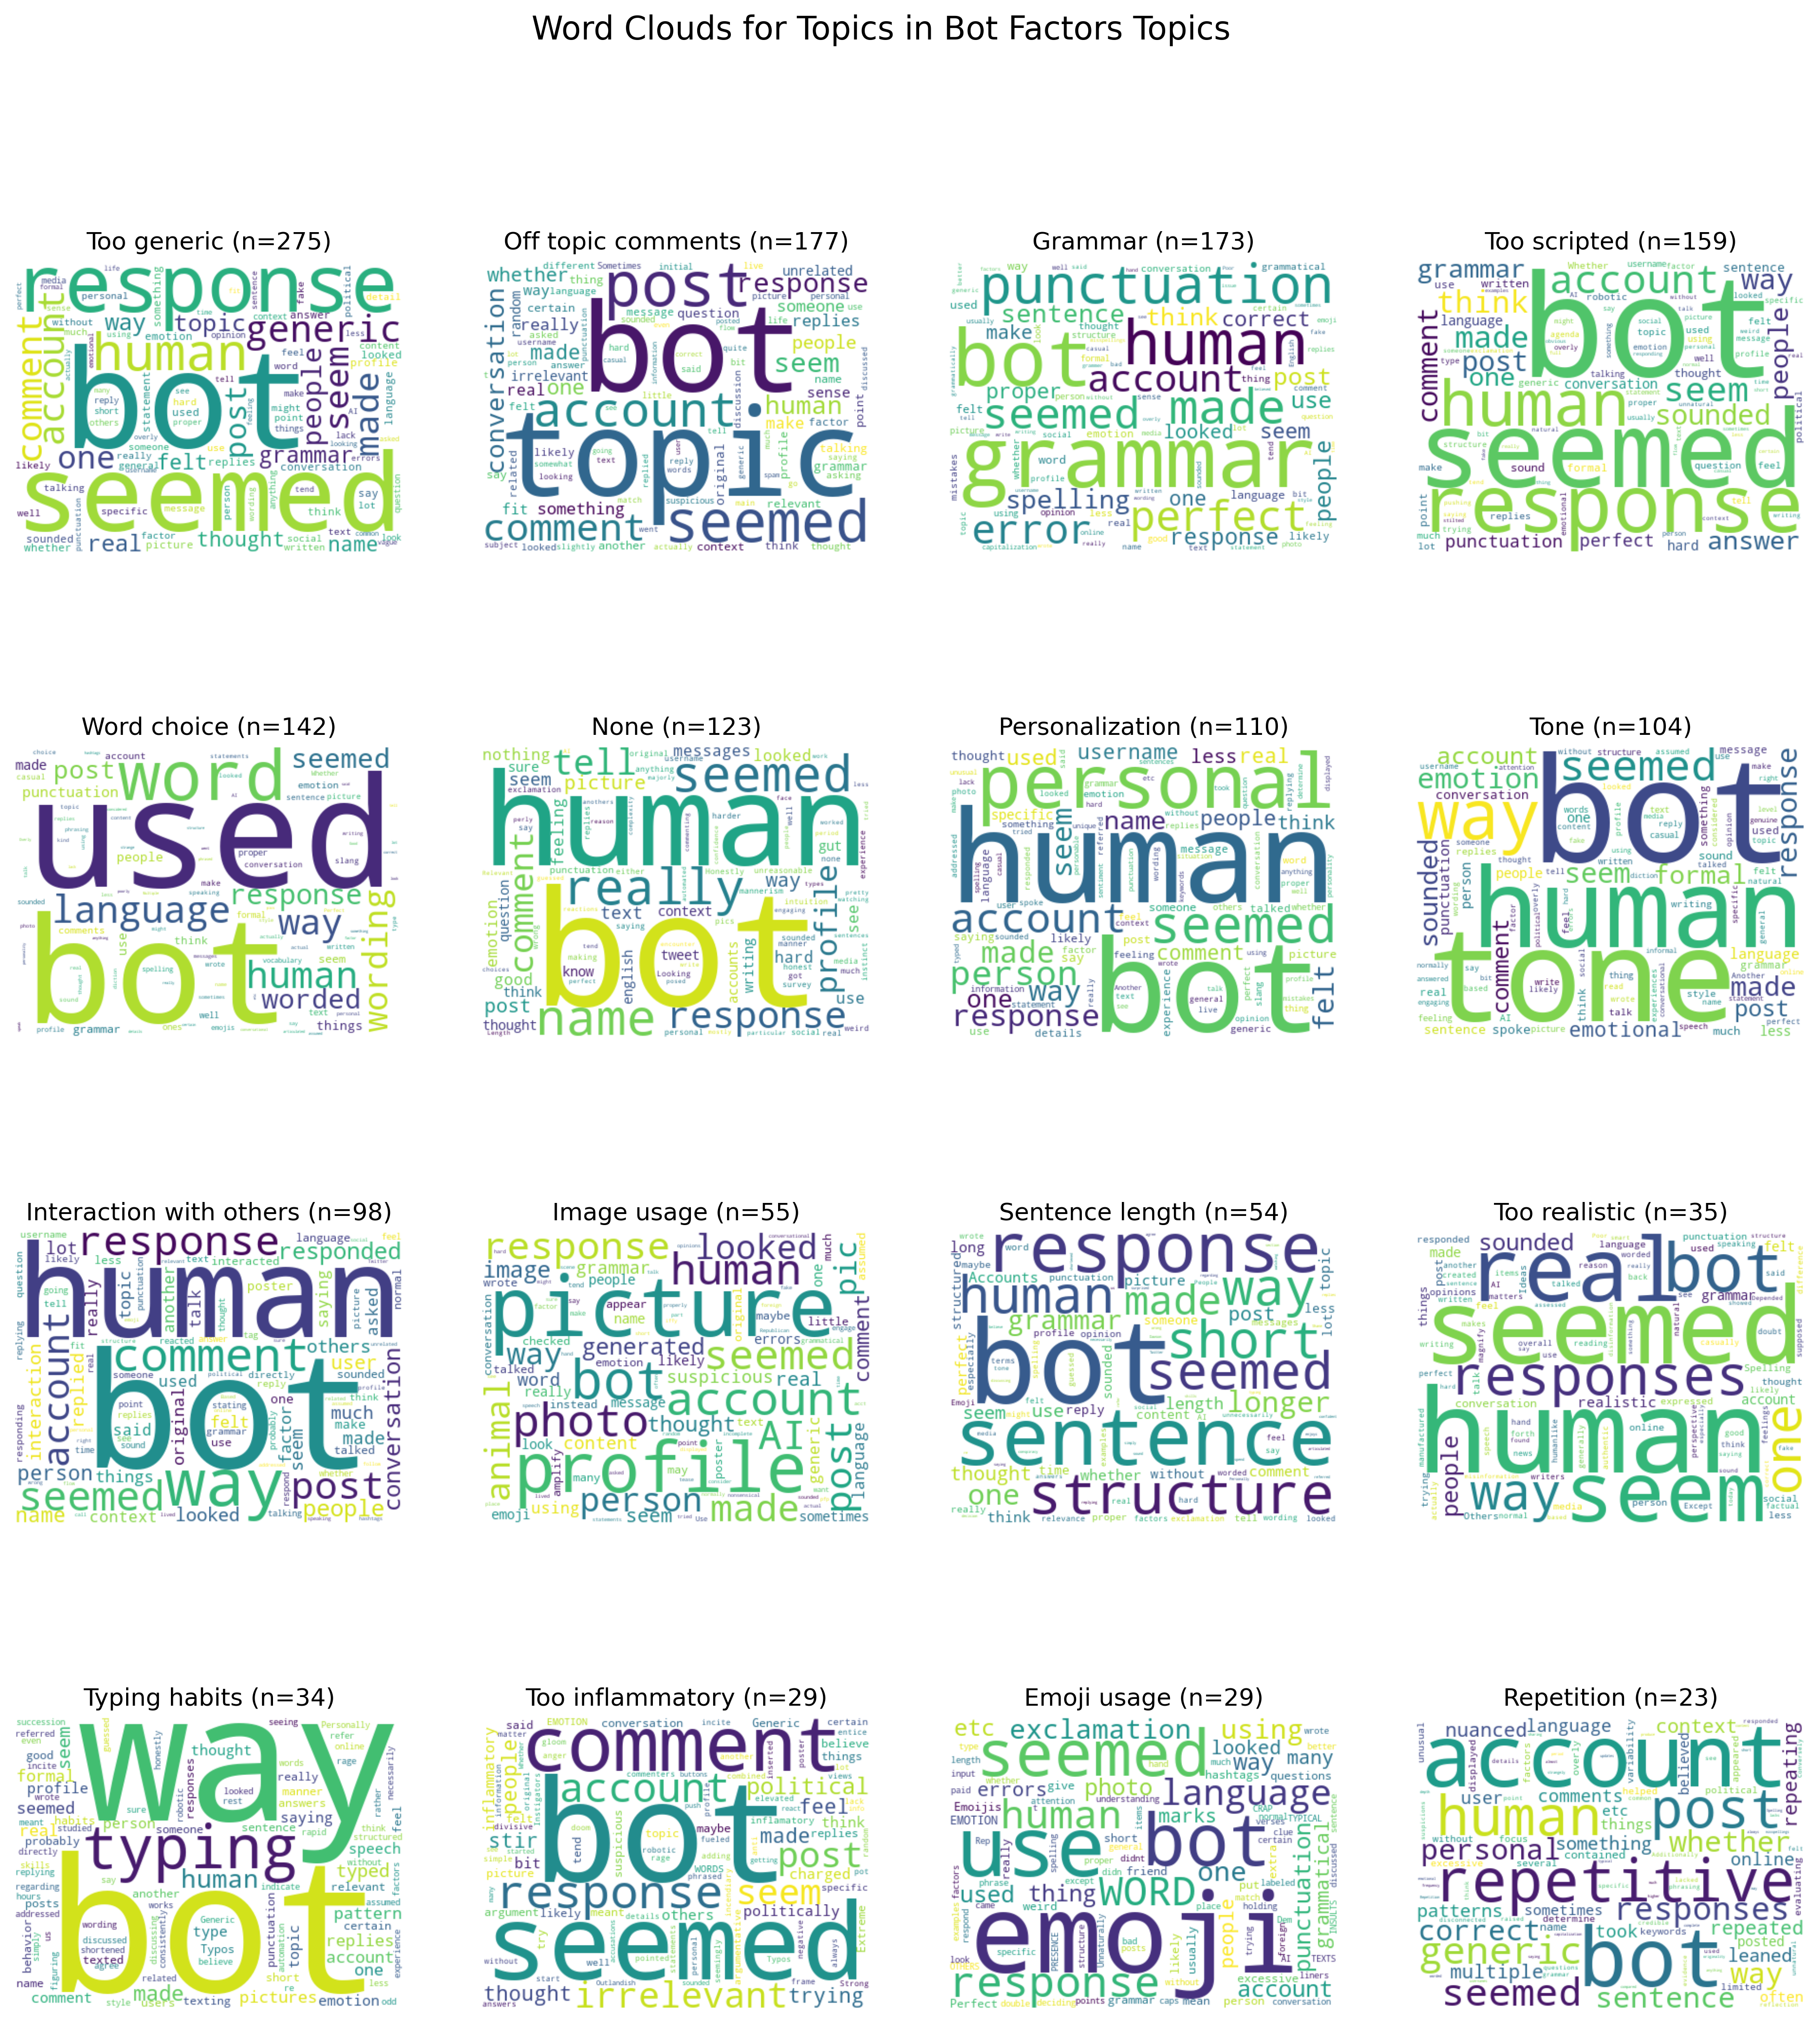
These wordclouds show the most common terms within each topic from the Bot Factors responses.
Political Affiliation: AI Open Concerns
Democrat AI Open Concerns Network
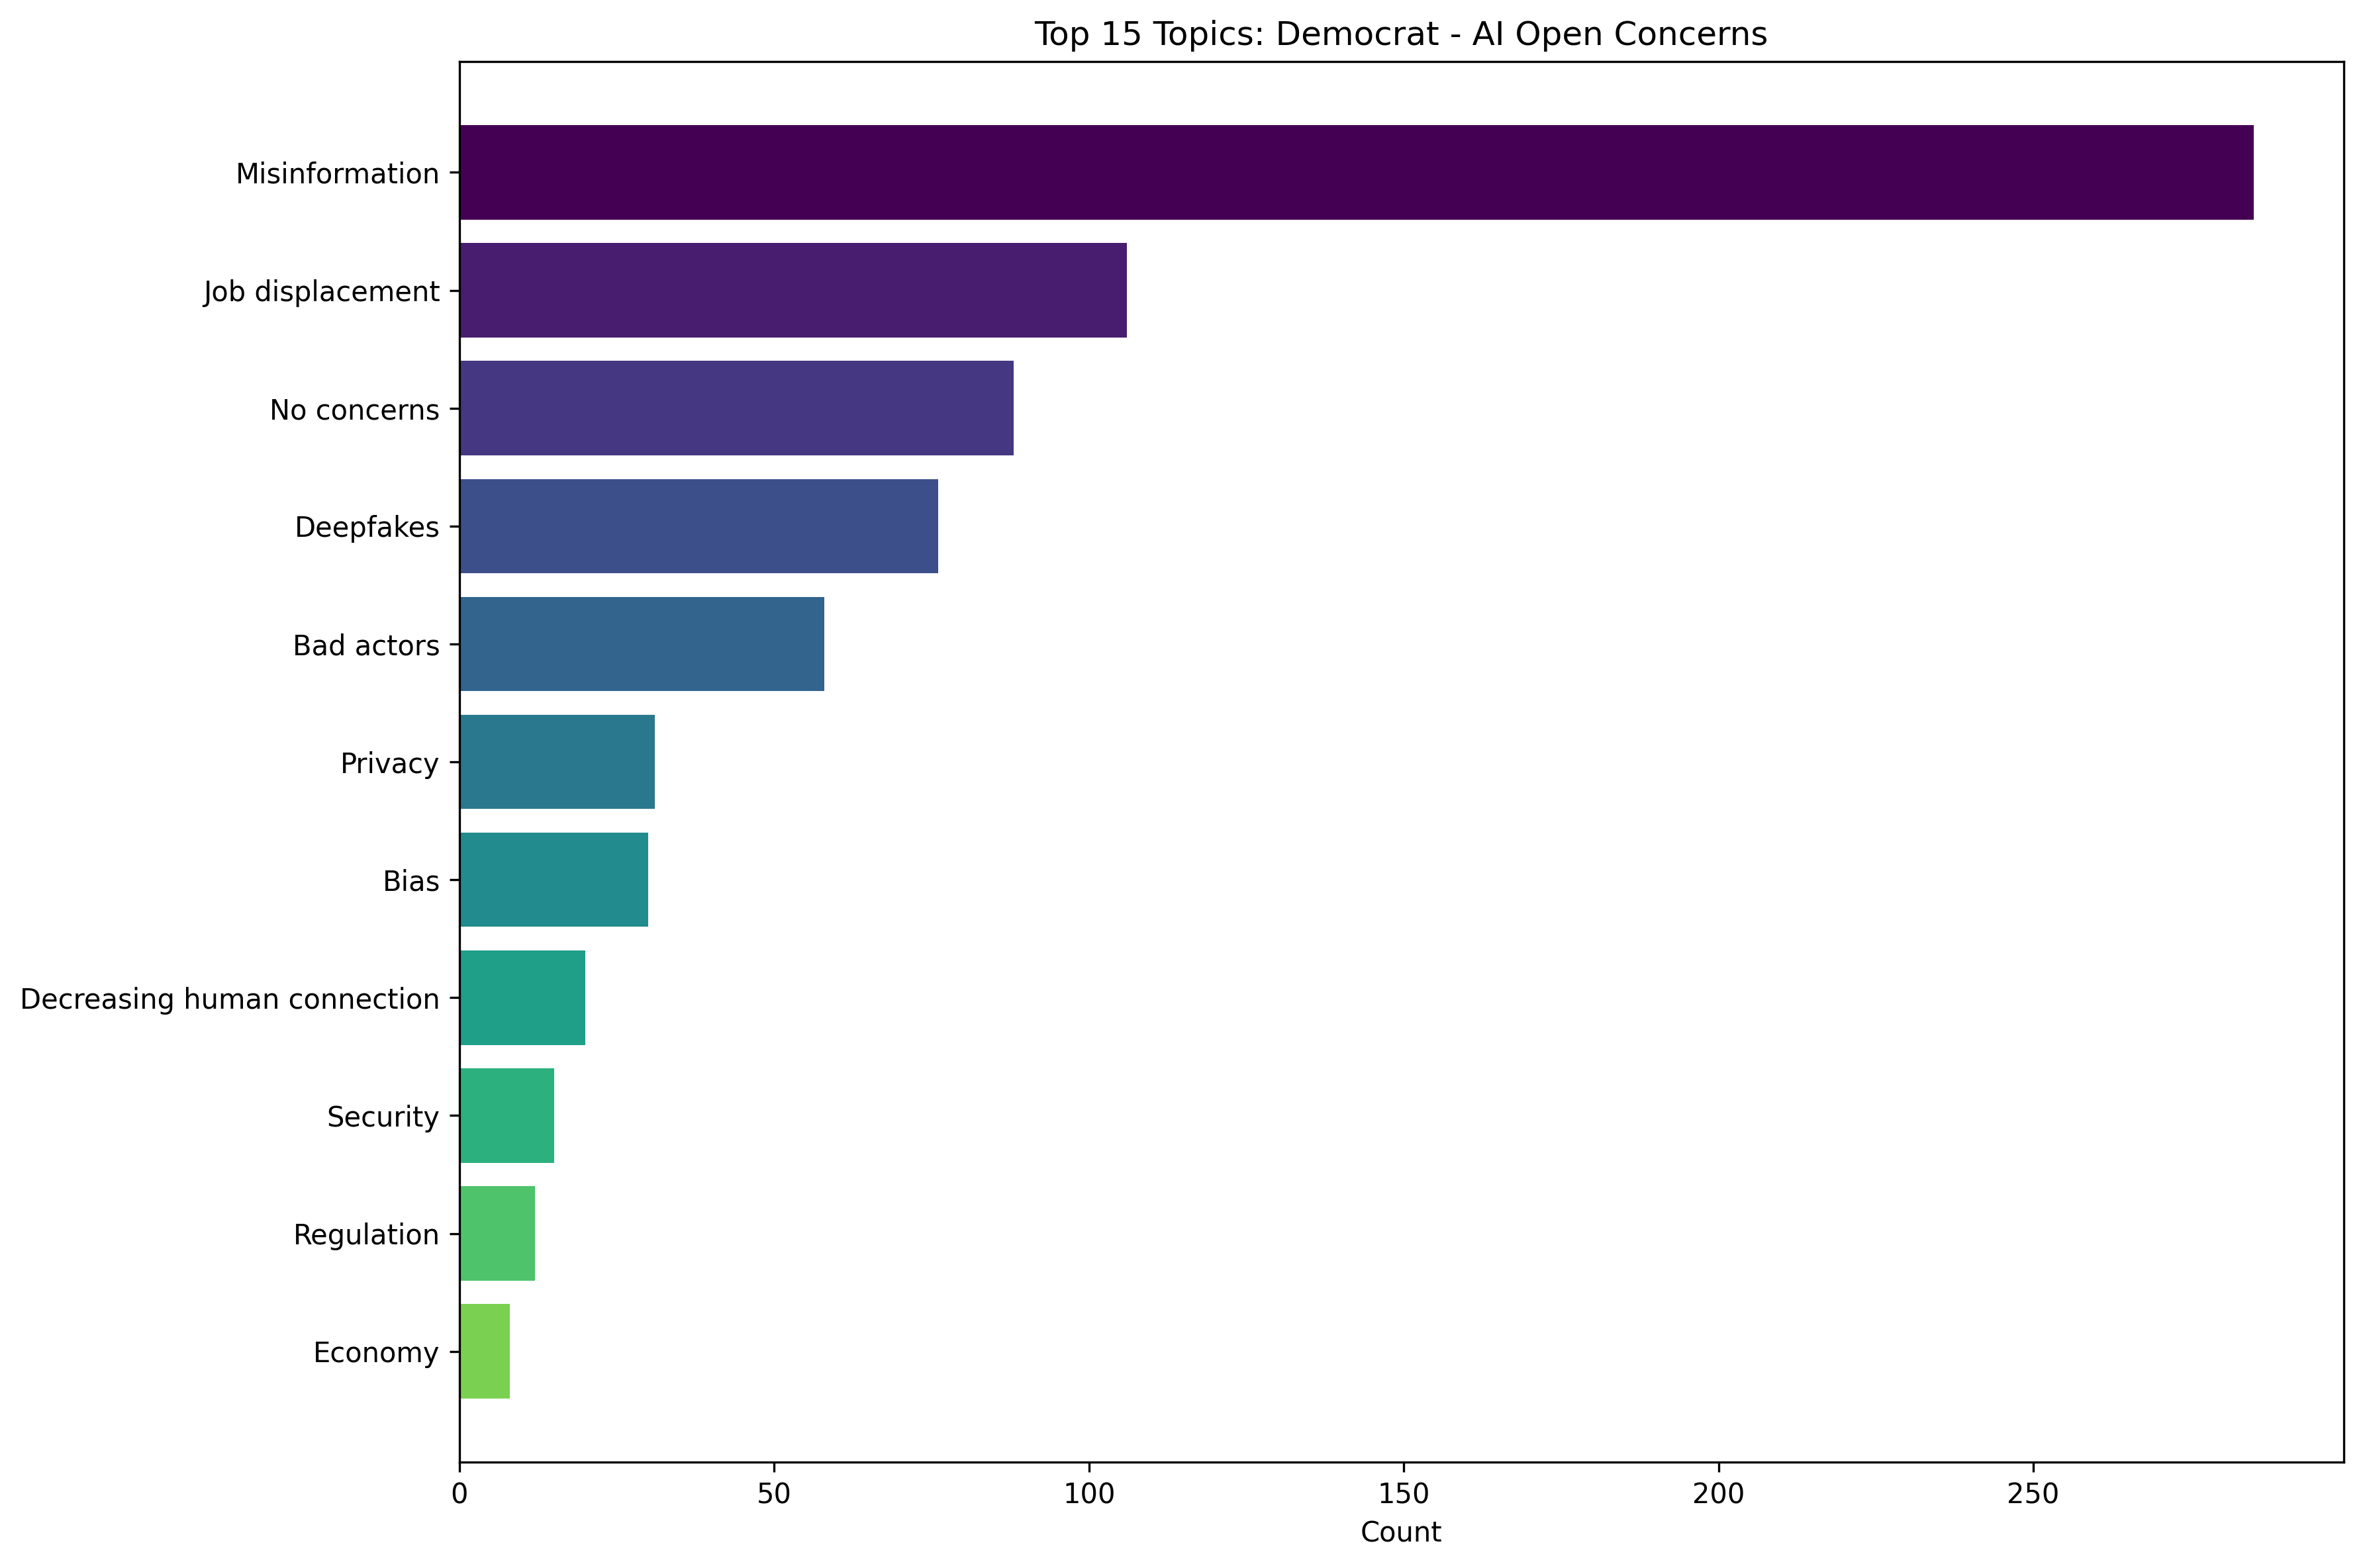
Network visualization of AI concerns from Democratic respondents. This shows how concerns are connected among Democrats.
Top Concerns for Democrats
Republican AI Open Concerns Network
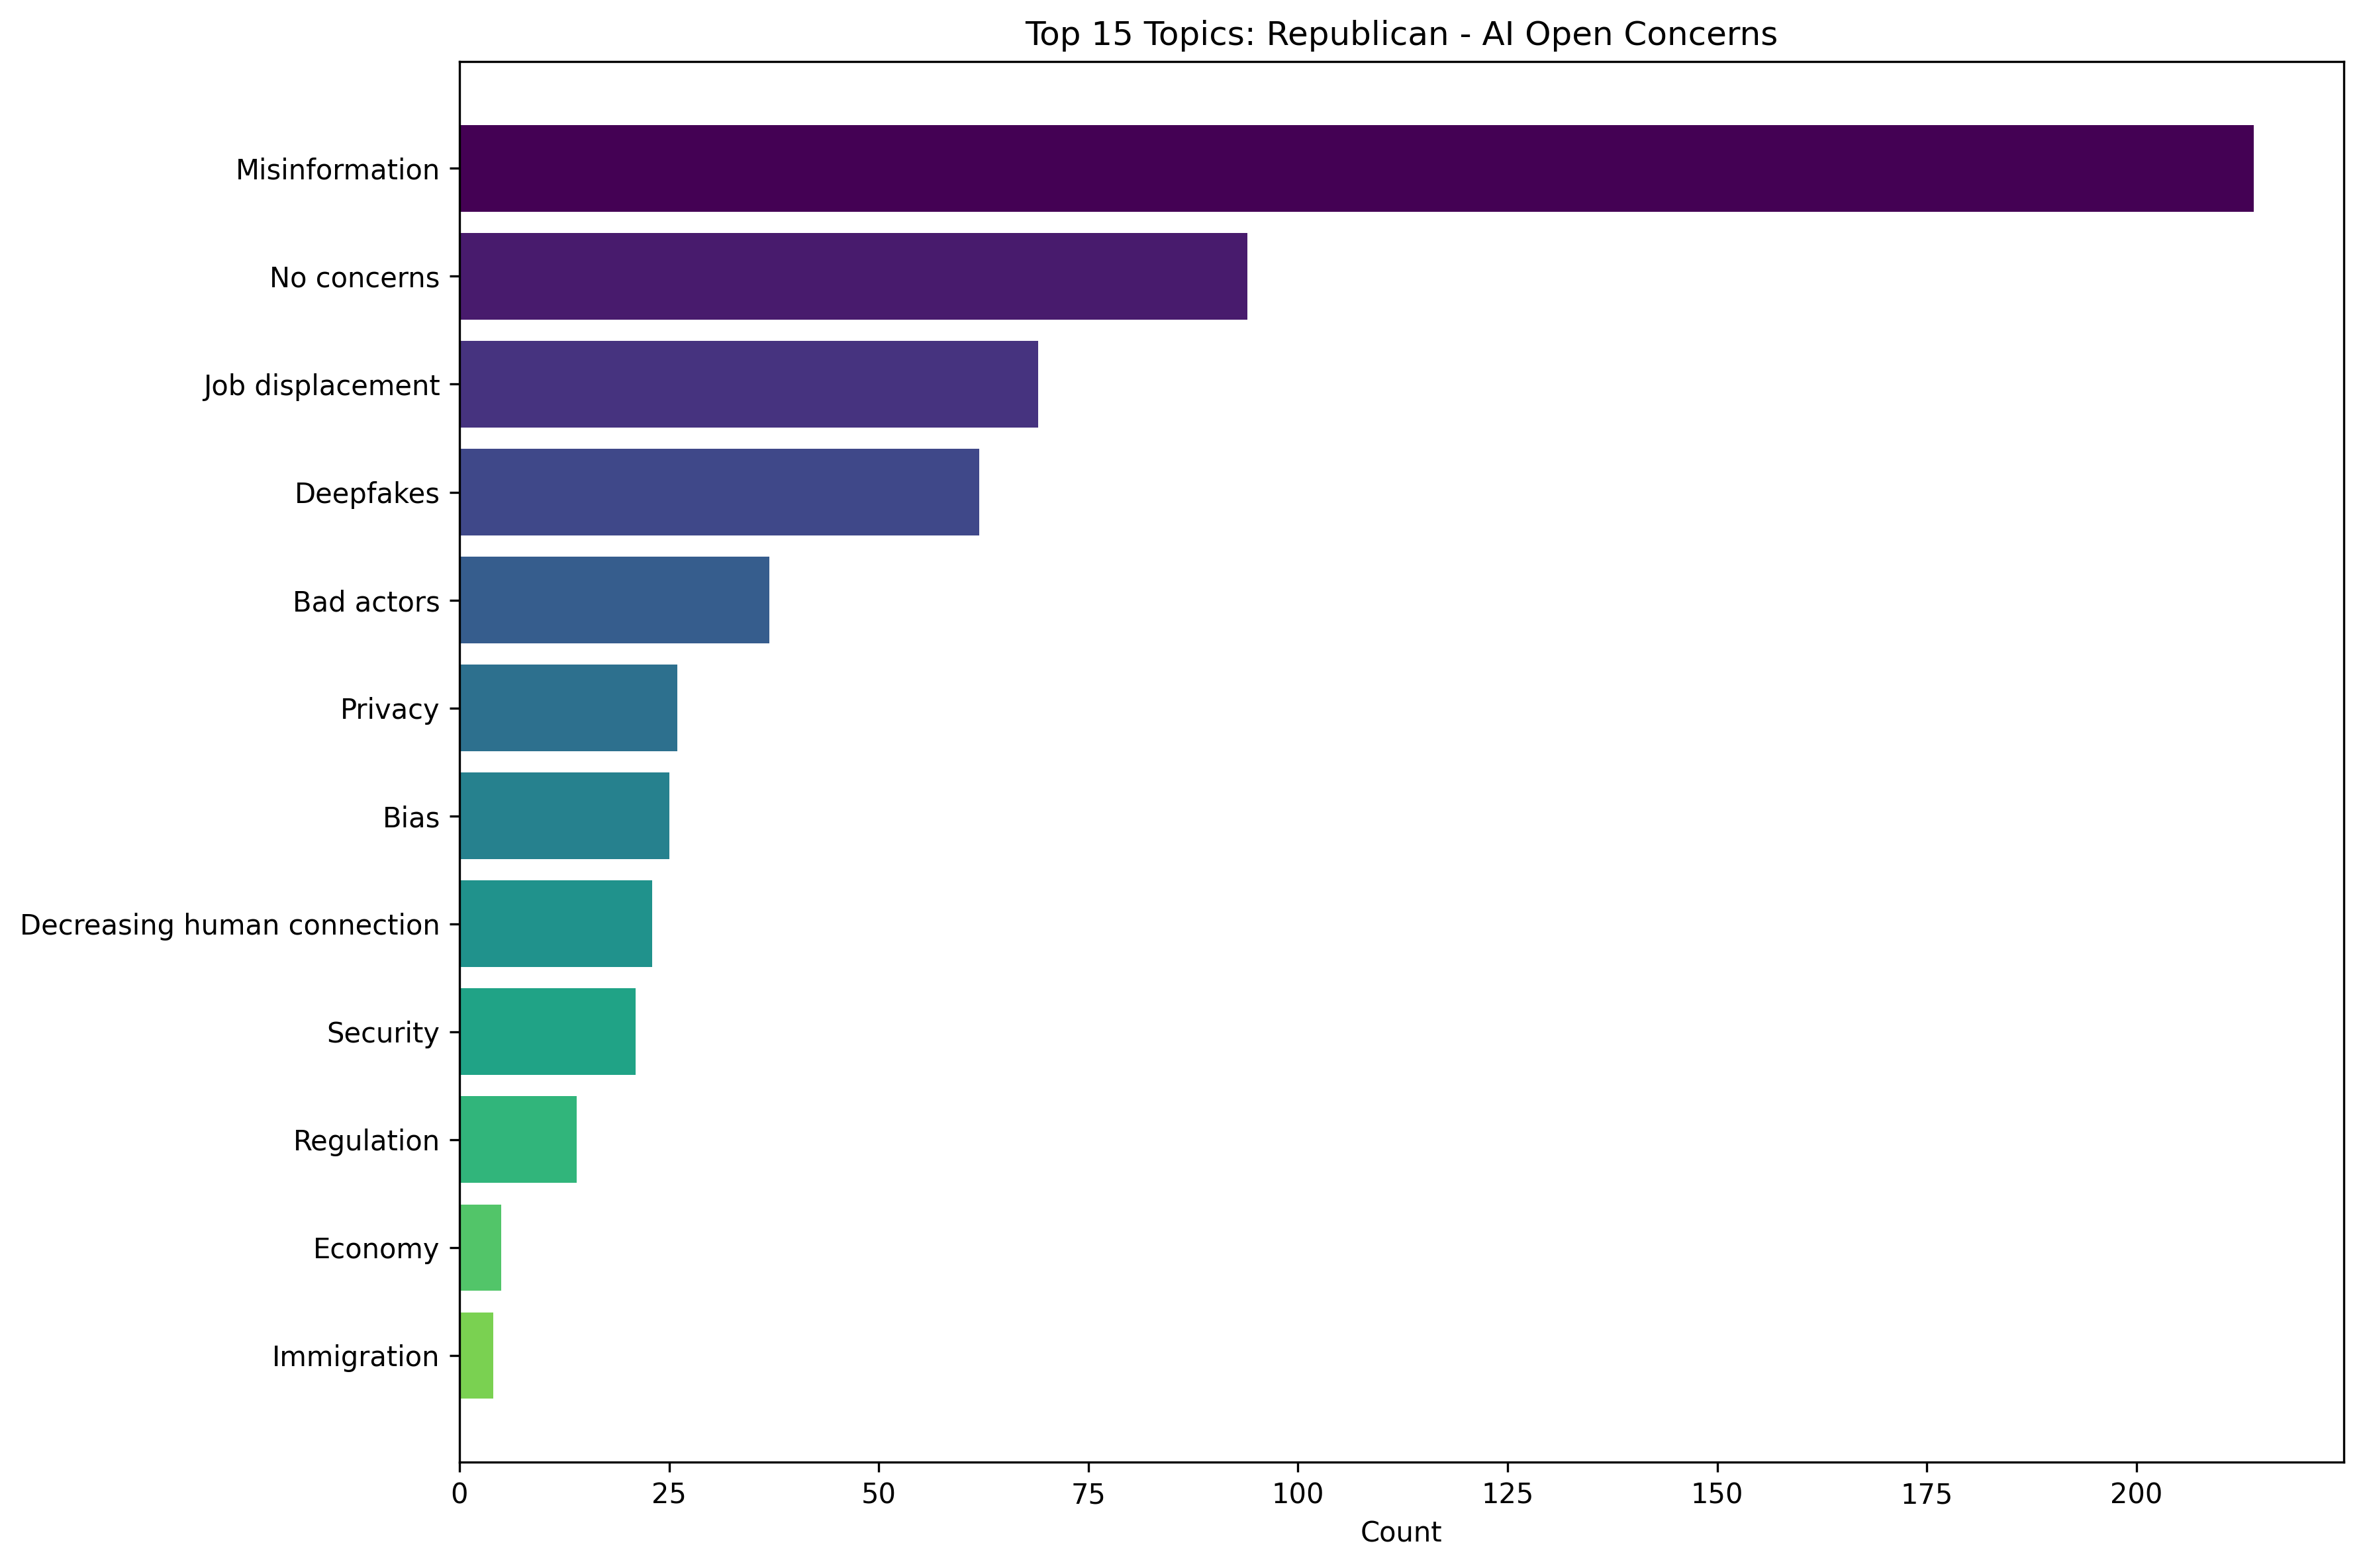
Network visualization of AI concerns from Republican respondents. This shows how concerns are connected among Republicans.
Top Concerns for Republicans
Political Affiliation: Bot Factors
Democrat Bot Factors Network
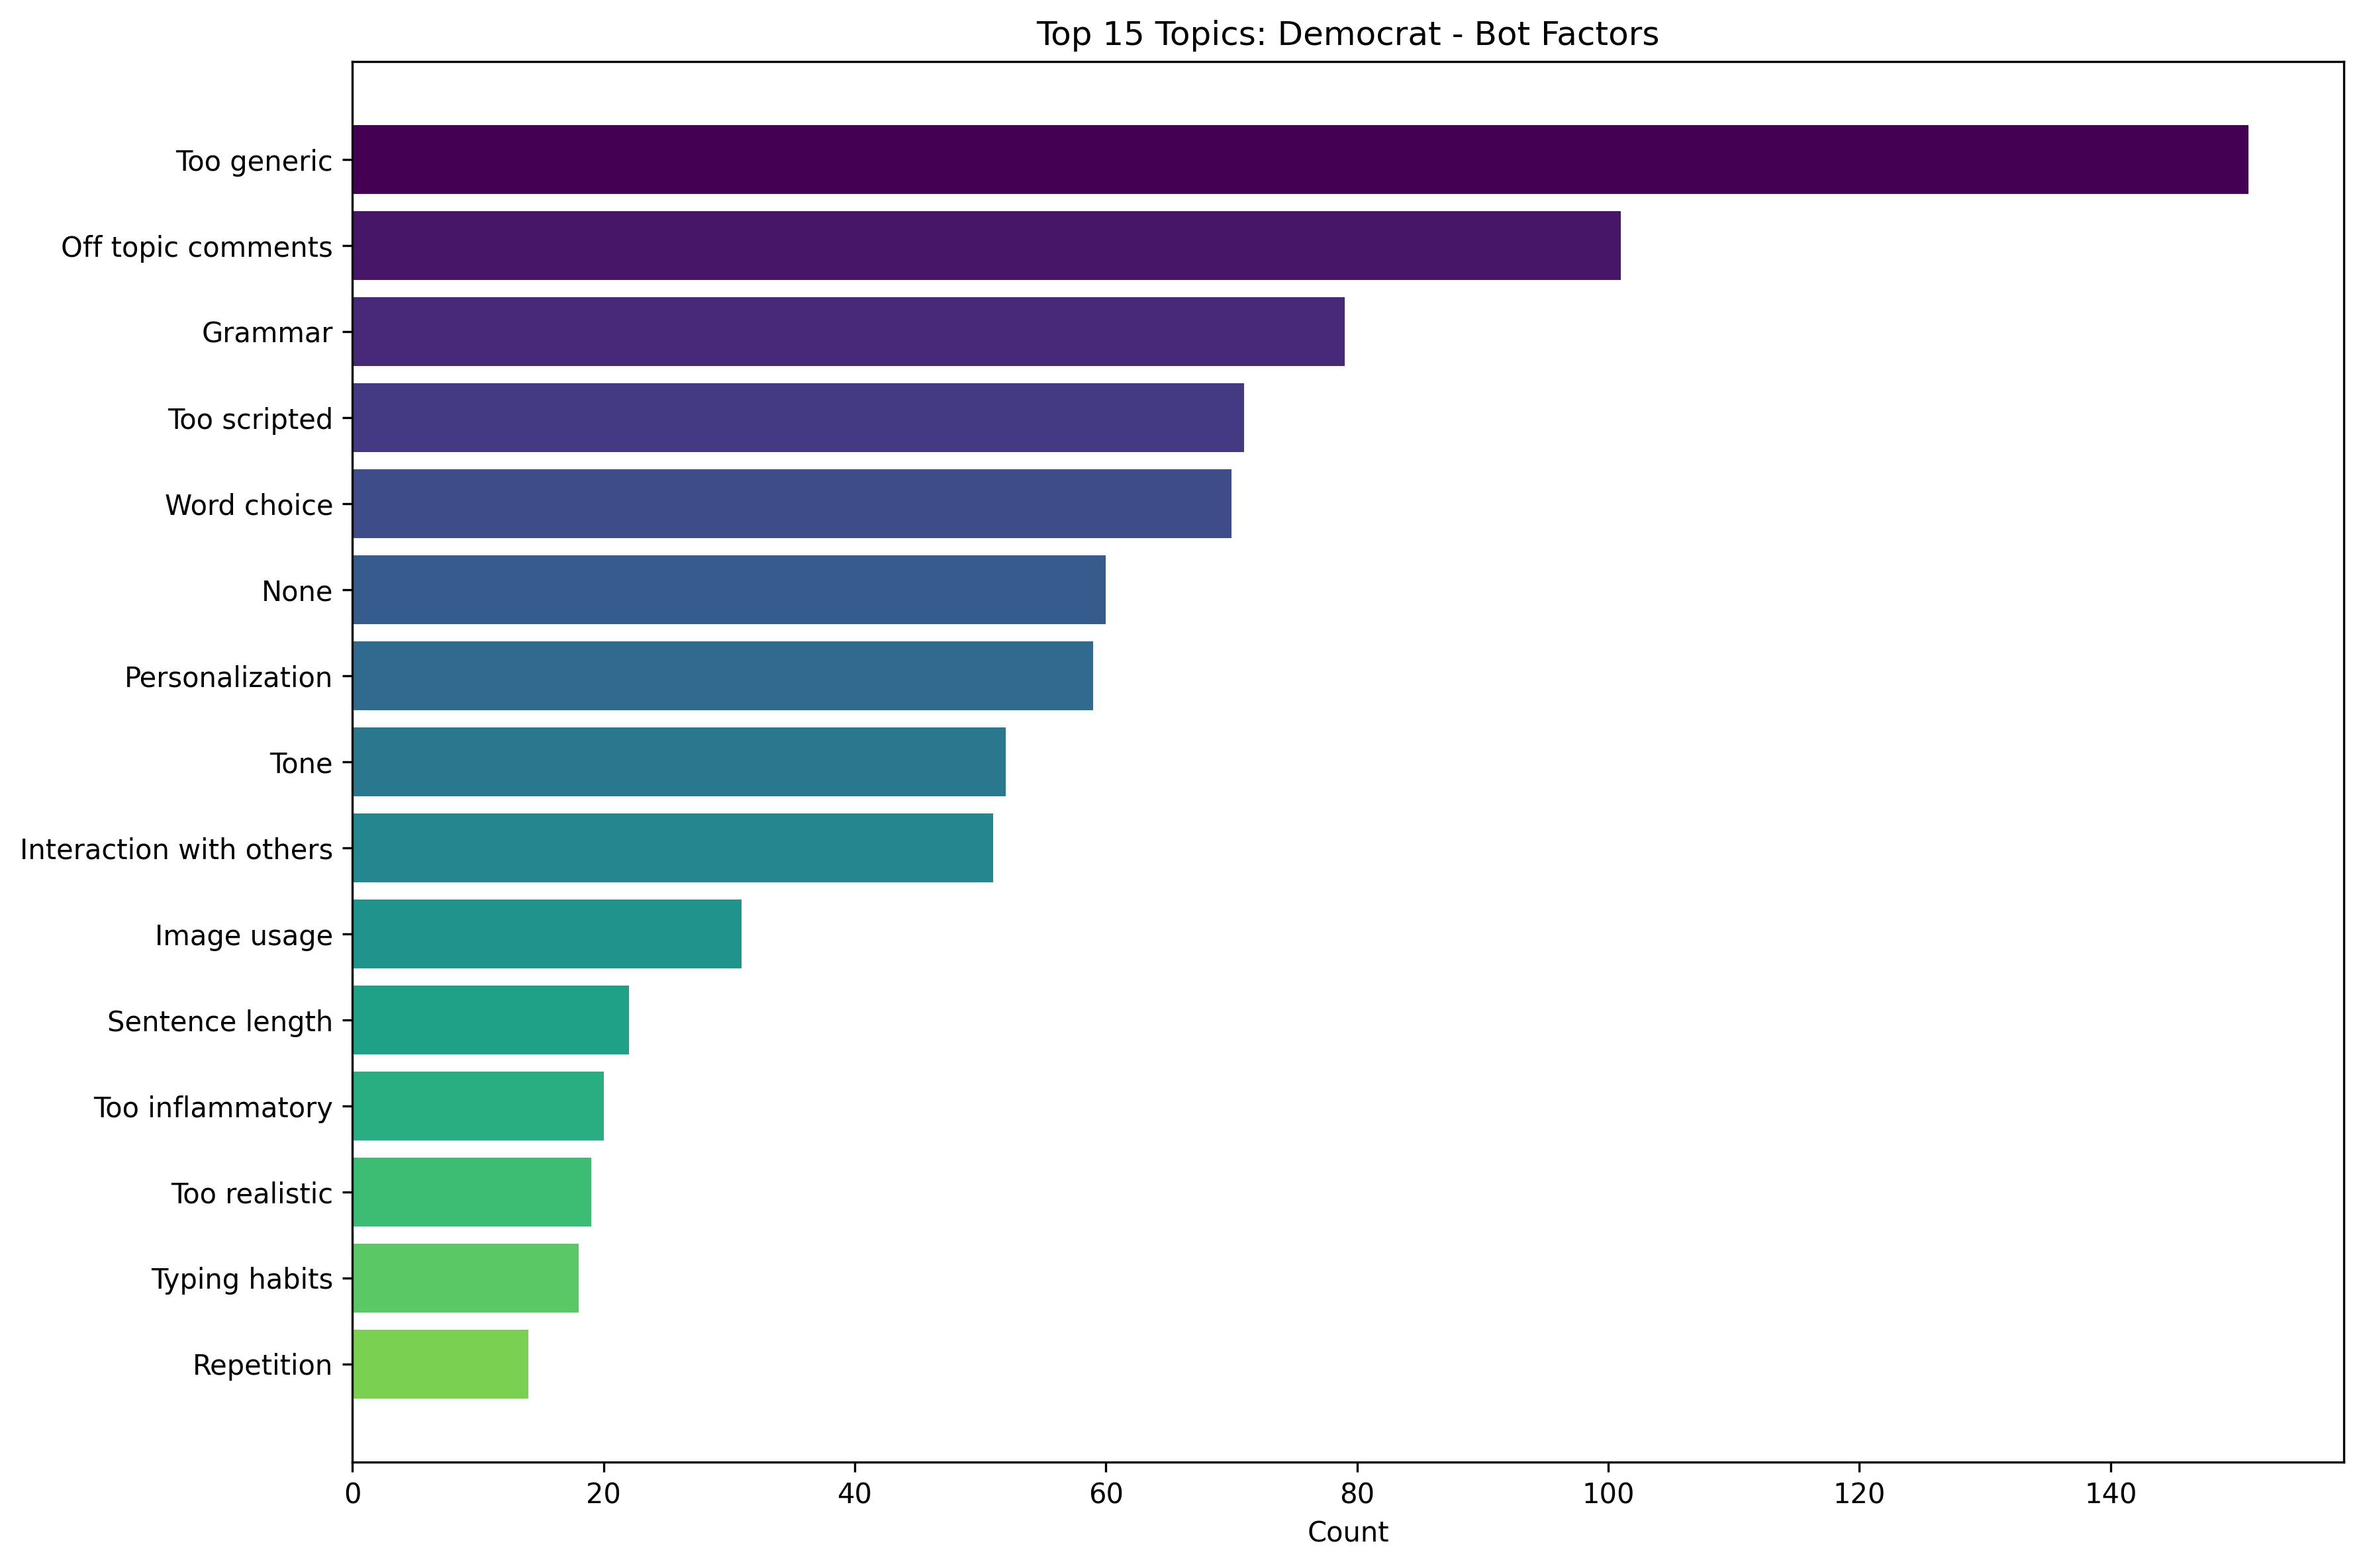
Network visualization of bot factors mentioned by Democratic respondents. This shows what features made profiles seem more bot-like to Democrats.
Top Bot Factors for Democrats
Republican Bot Factors Network
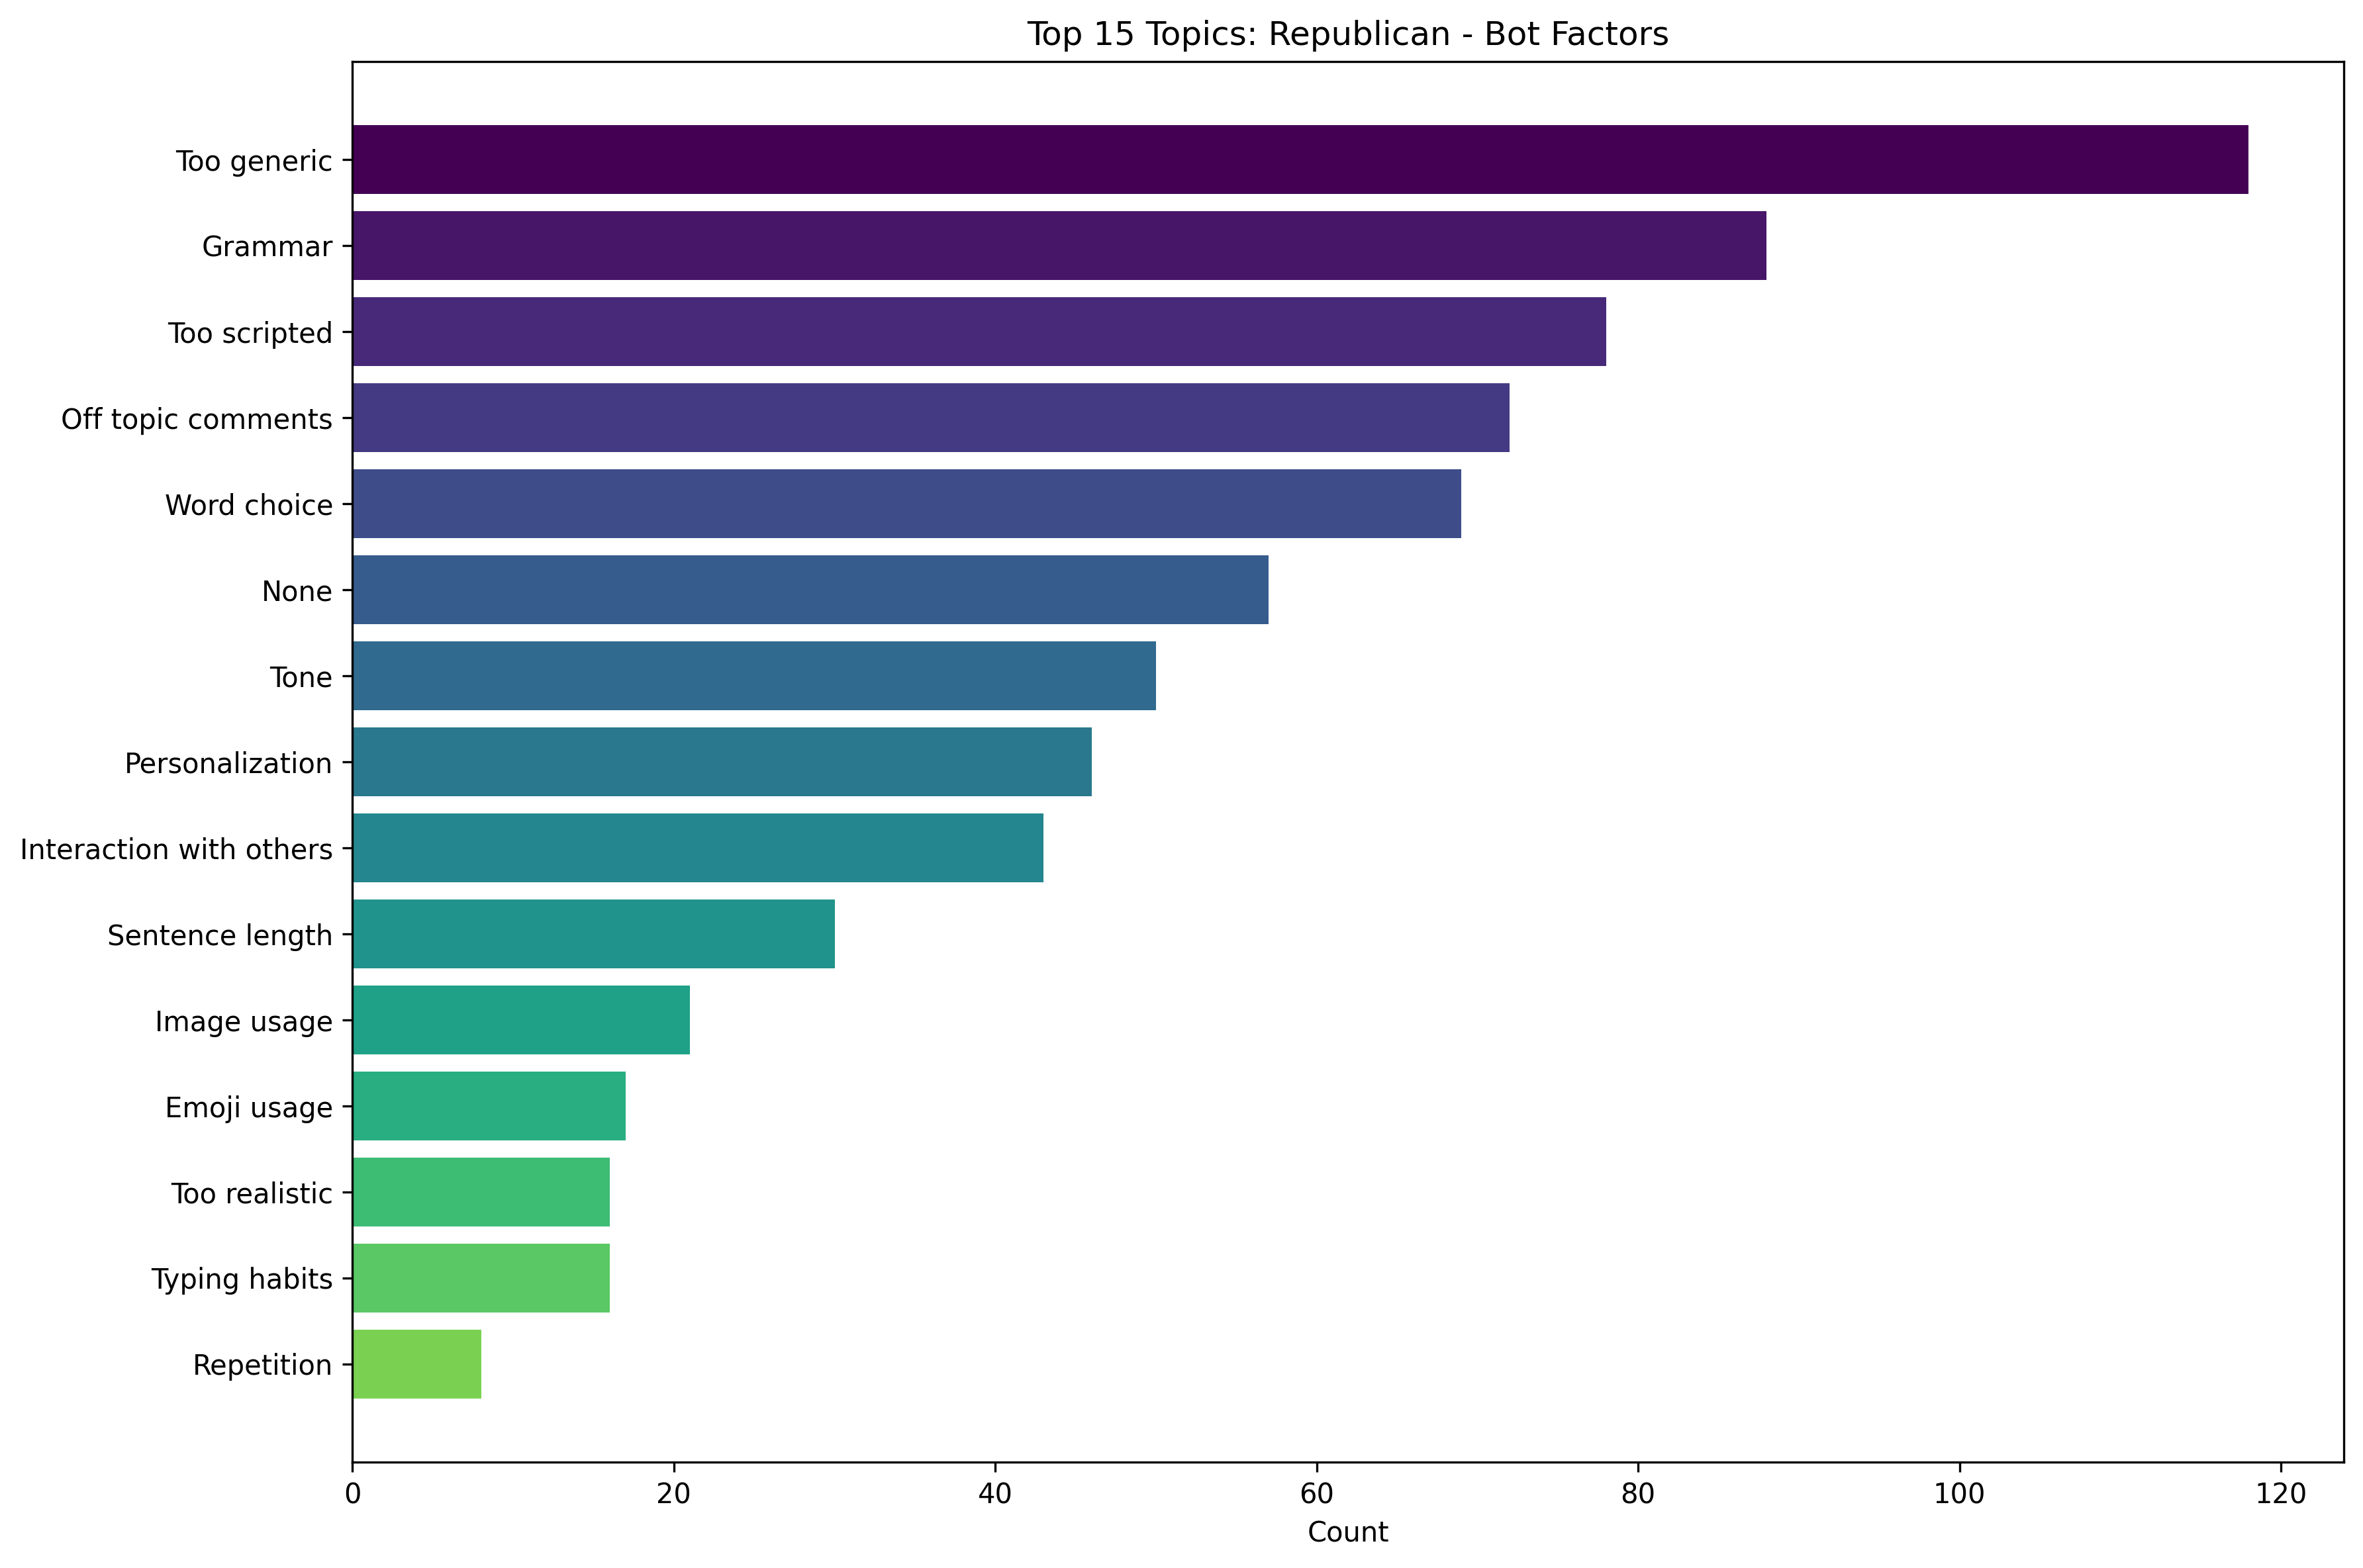
Network visualization of bot factors mentioned by Republican respondents. This shows what features made profiles seem more bot-like to Republicans.
Top Bot Factors for Republicans
Gender: AI Open Concerns
Male AI Open Concerns Network
Network visualization of AI concerns from male respondents.
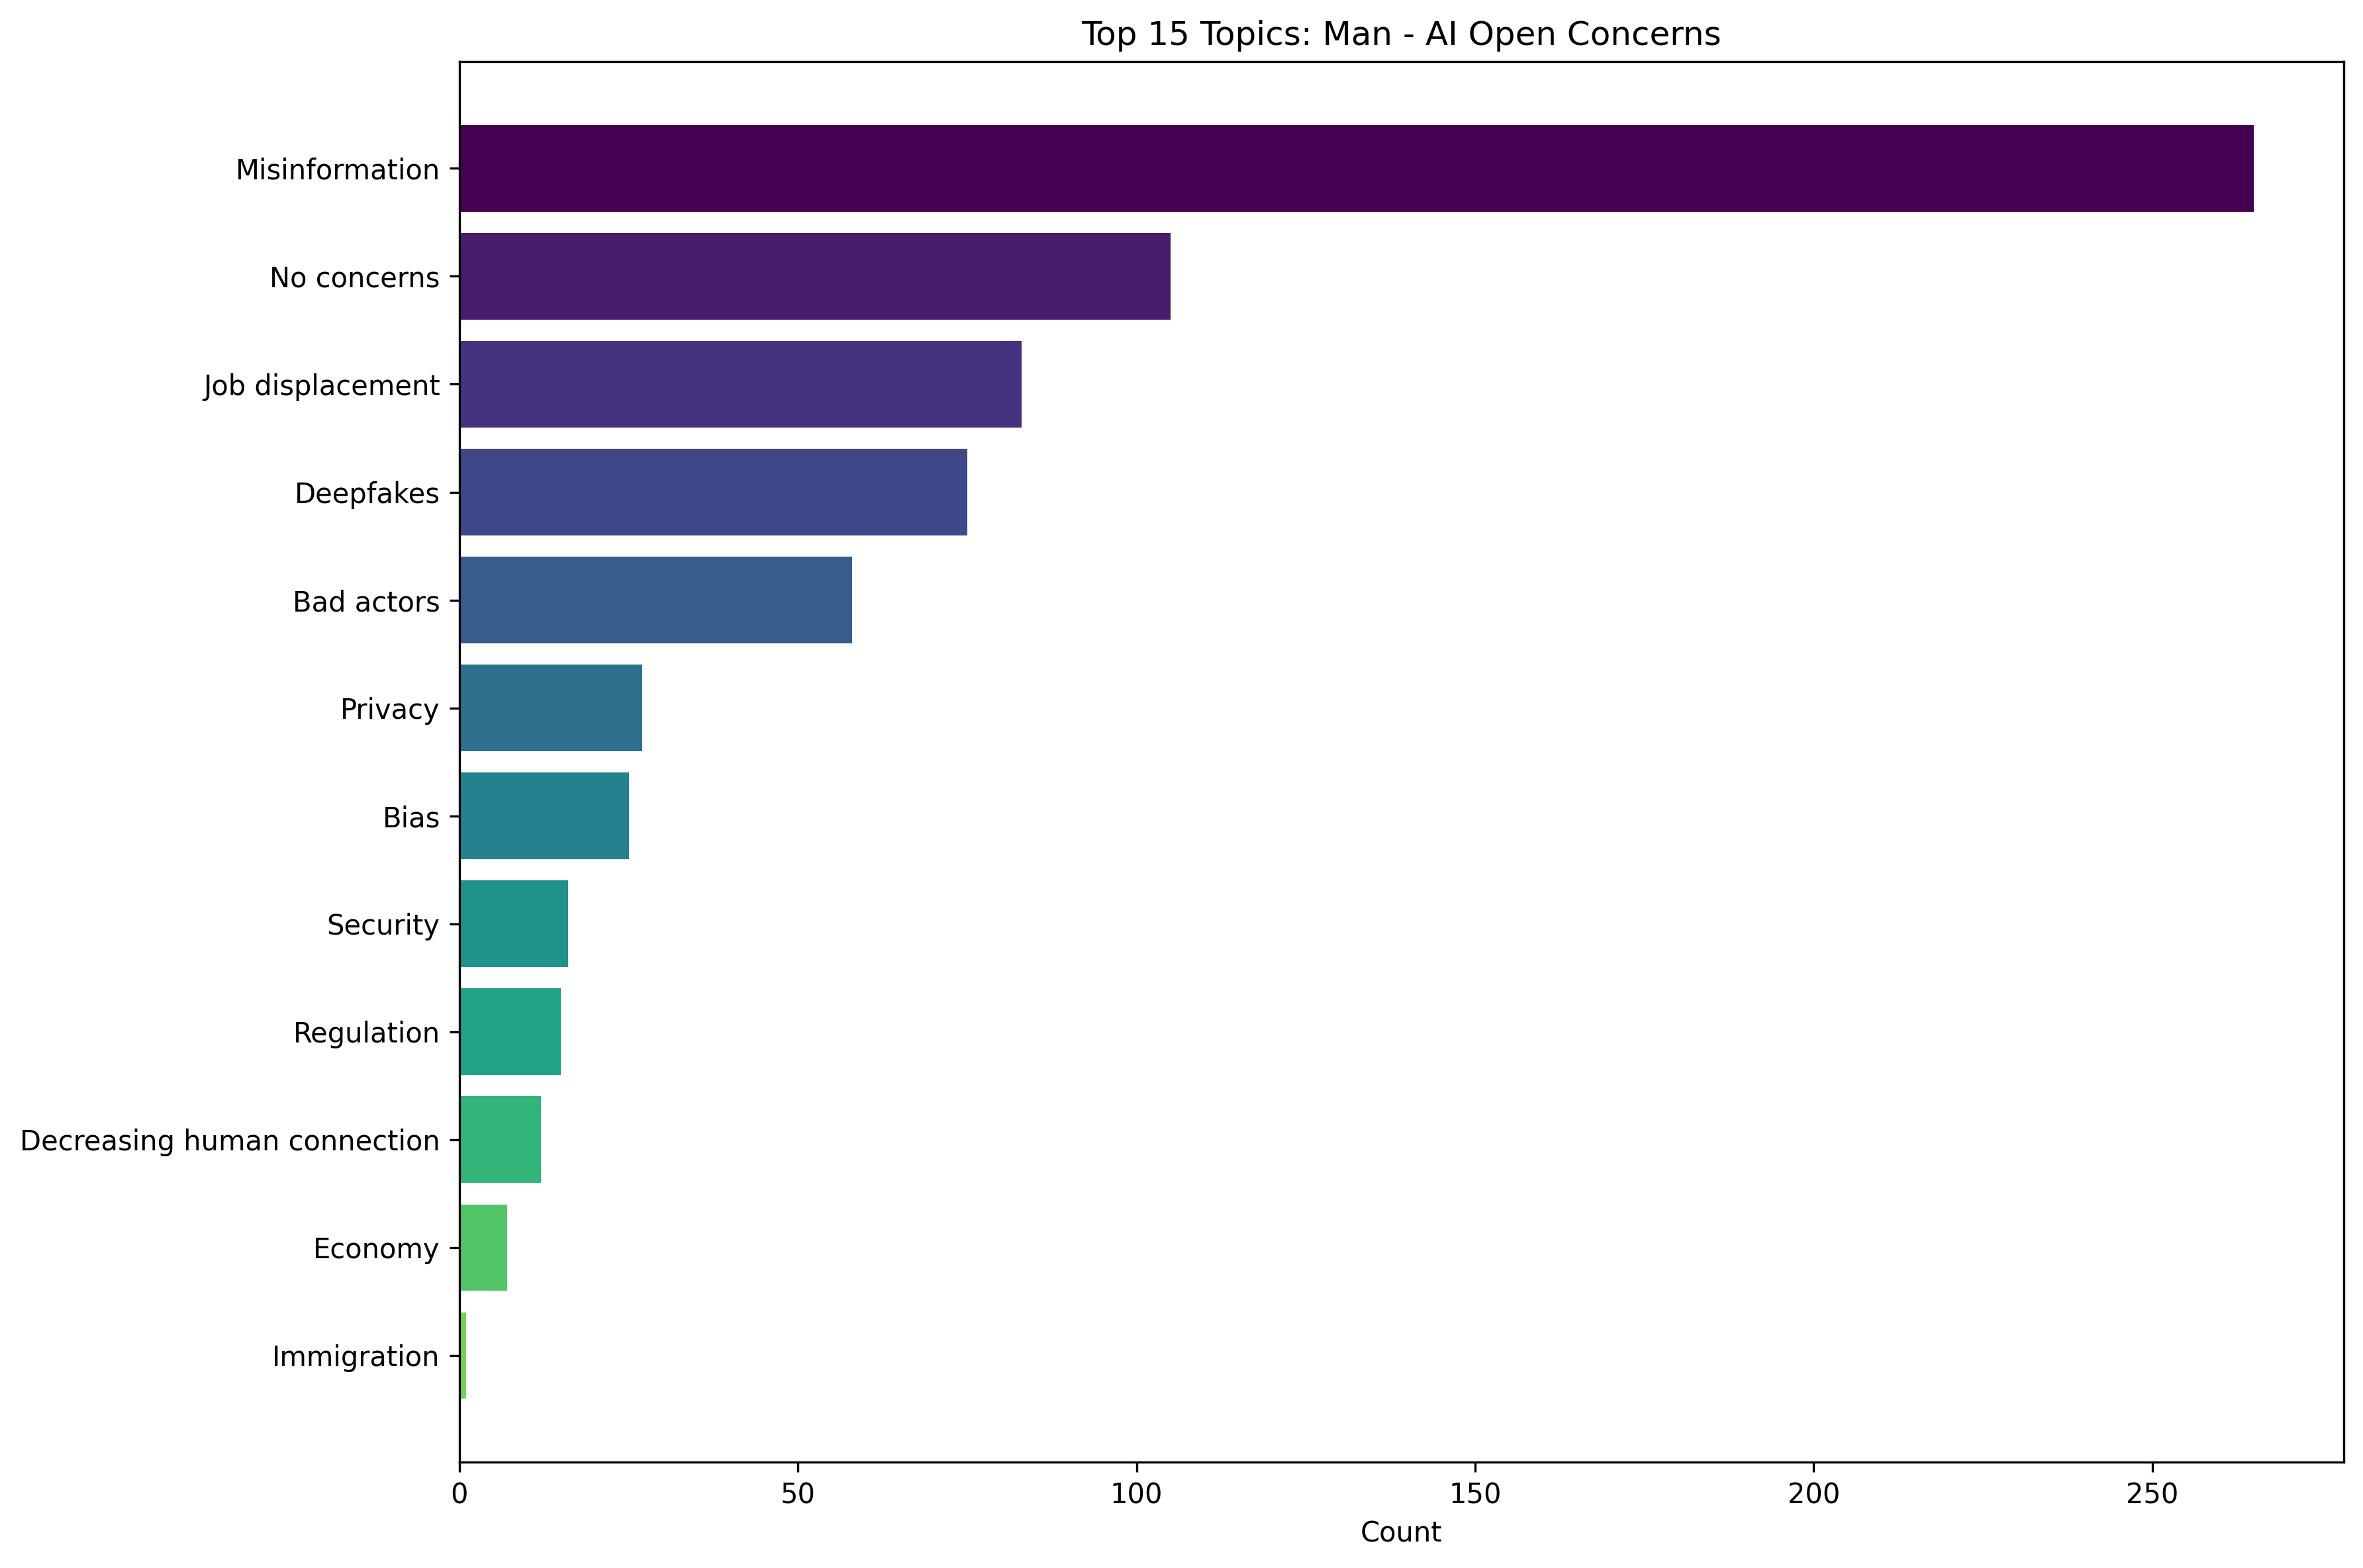
Top Concerns for Men
Female AI Open Concerns Network
Network visualization of AI concerns from female respondents.
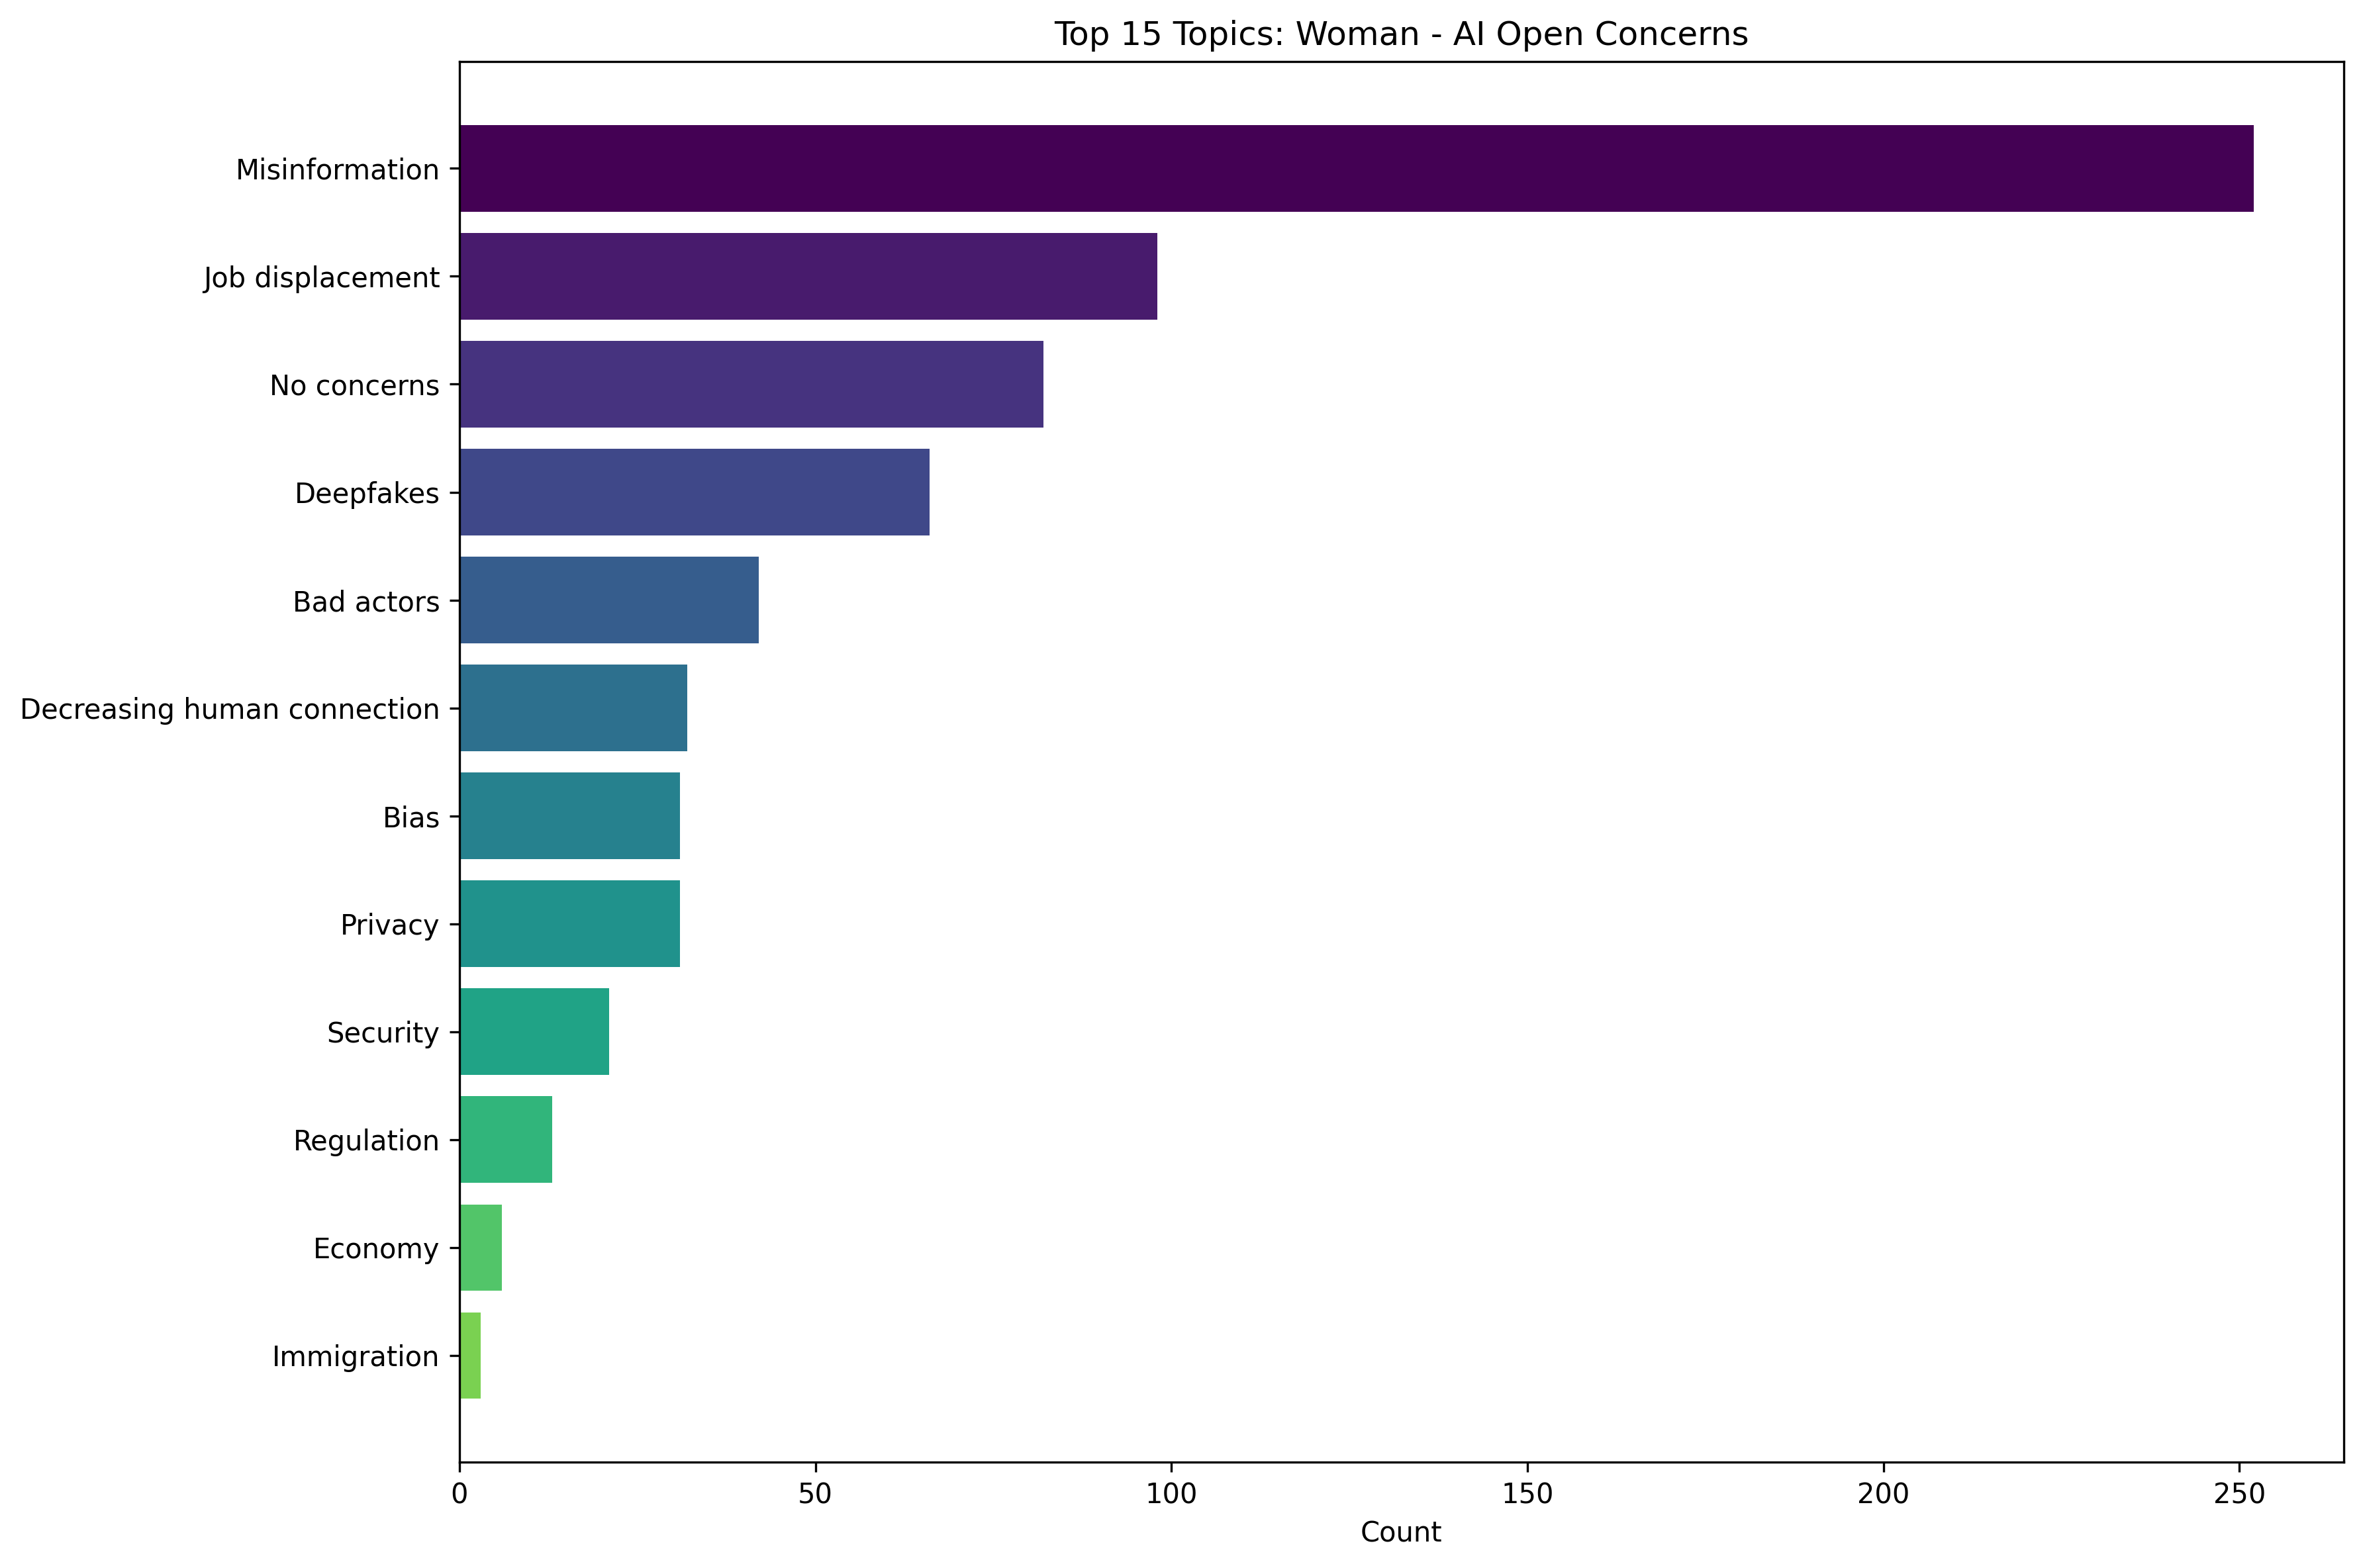
Top Concerns for Women
Gender: Bot Factors
Male Bot Factors Network
Network visualization of bot factors mentioned by male respondents.
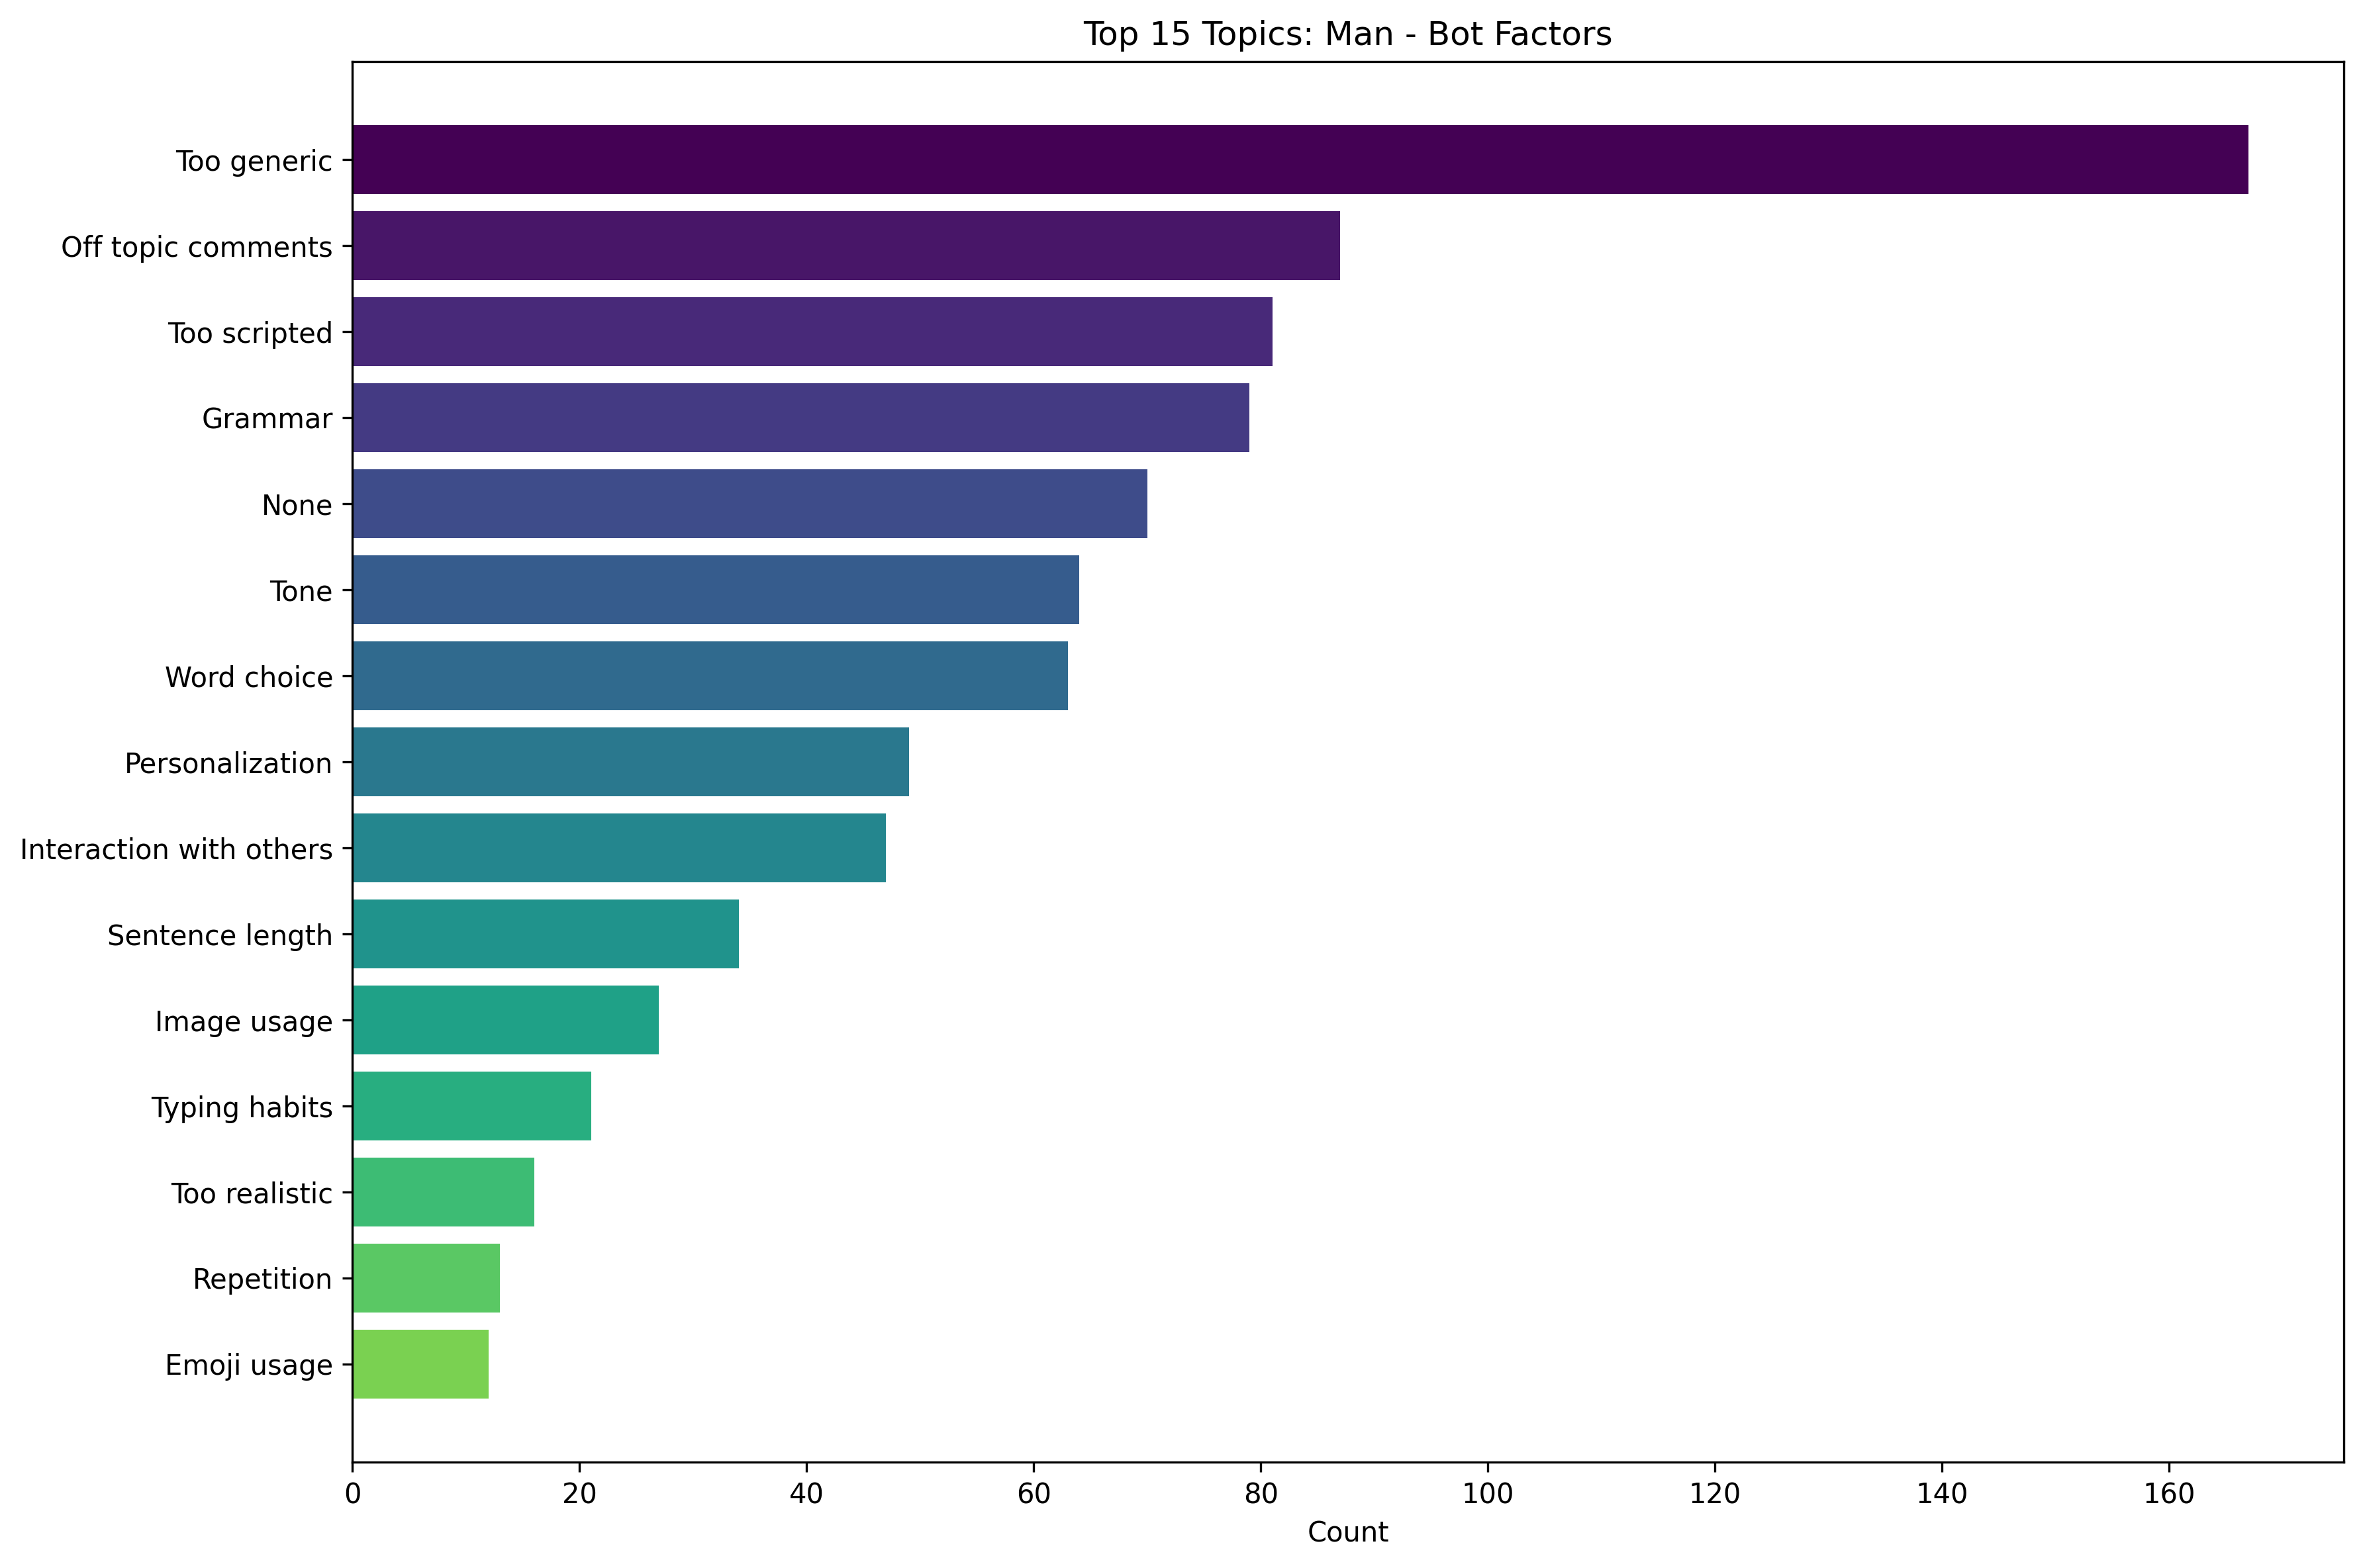
Top Bot Factors for Men
Female Bot Factors Network
Network visualization of bot factors mentioned by female respondents.
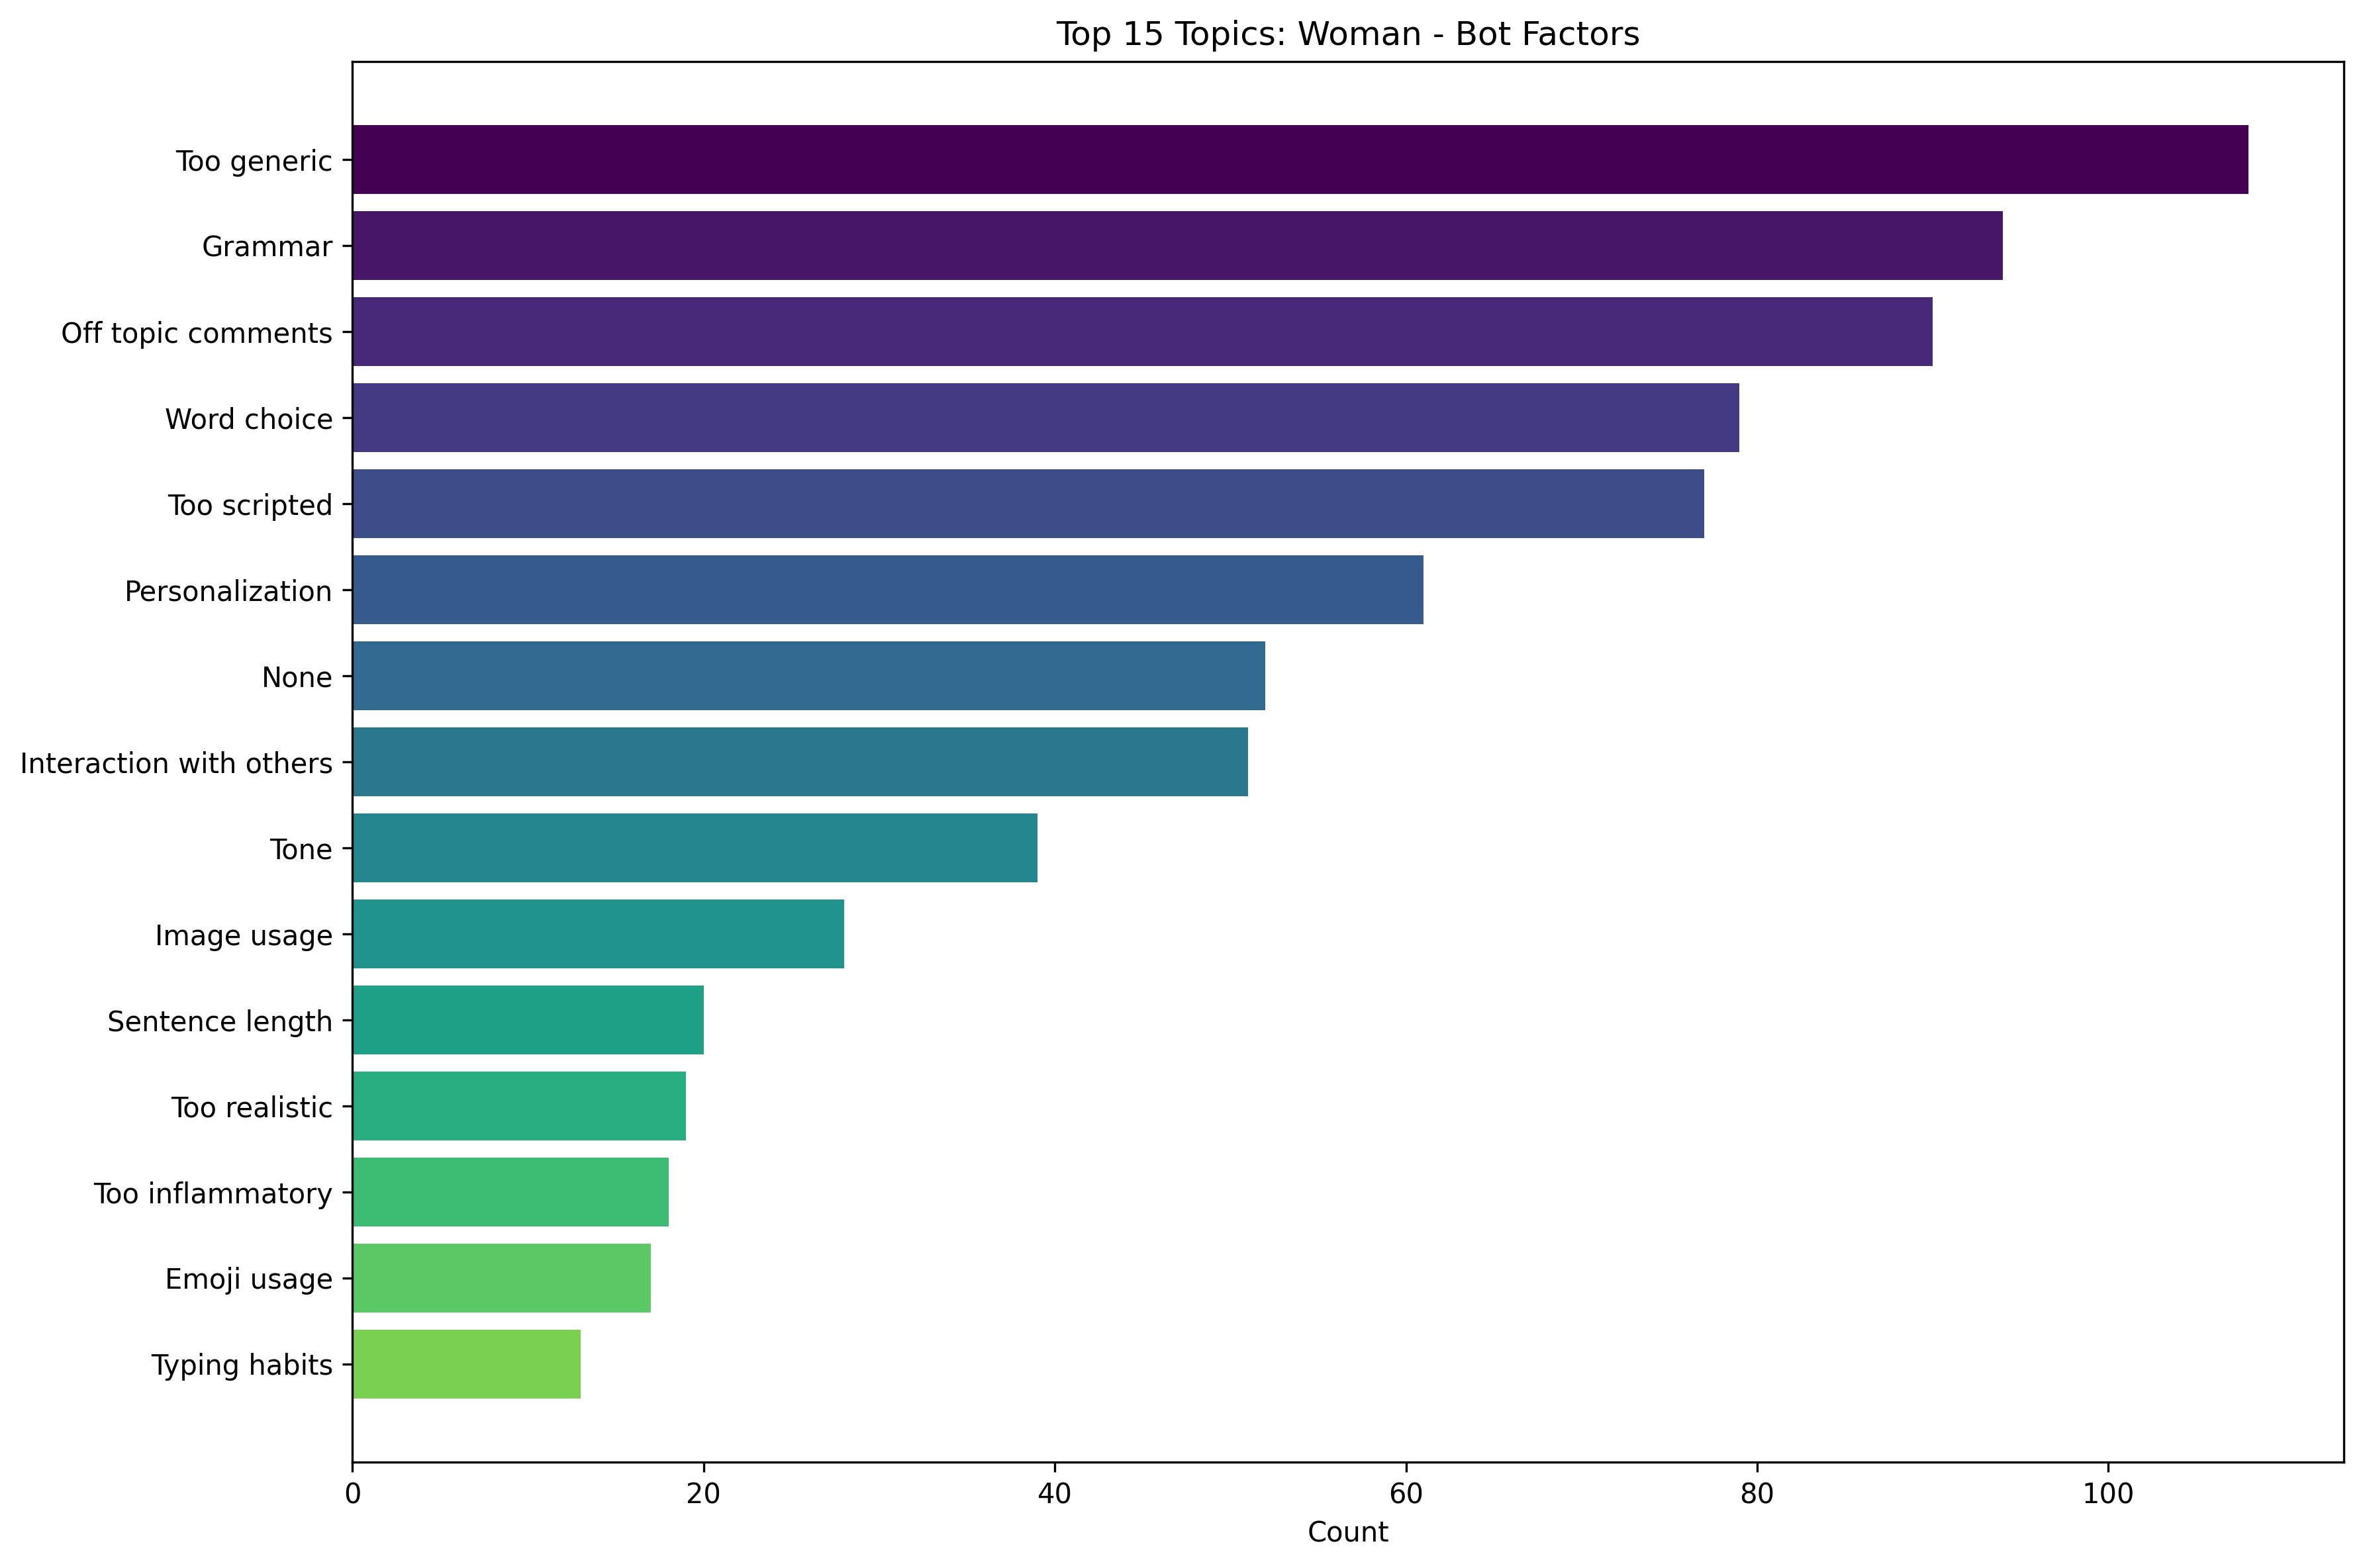
Top Bot Factors for Women
Race: AI Open Concerns
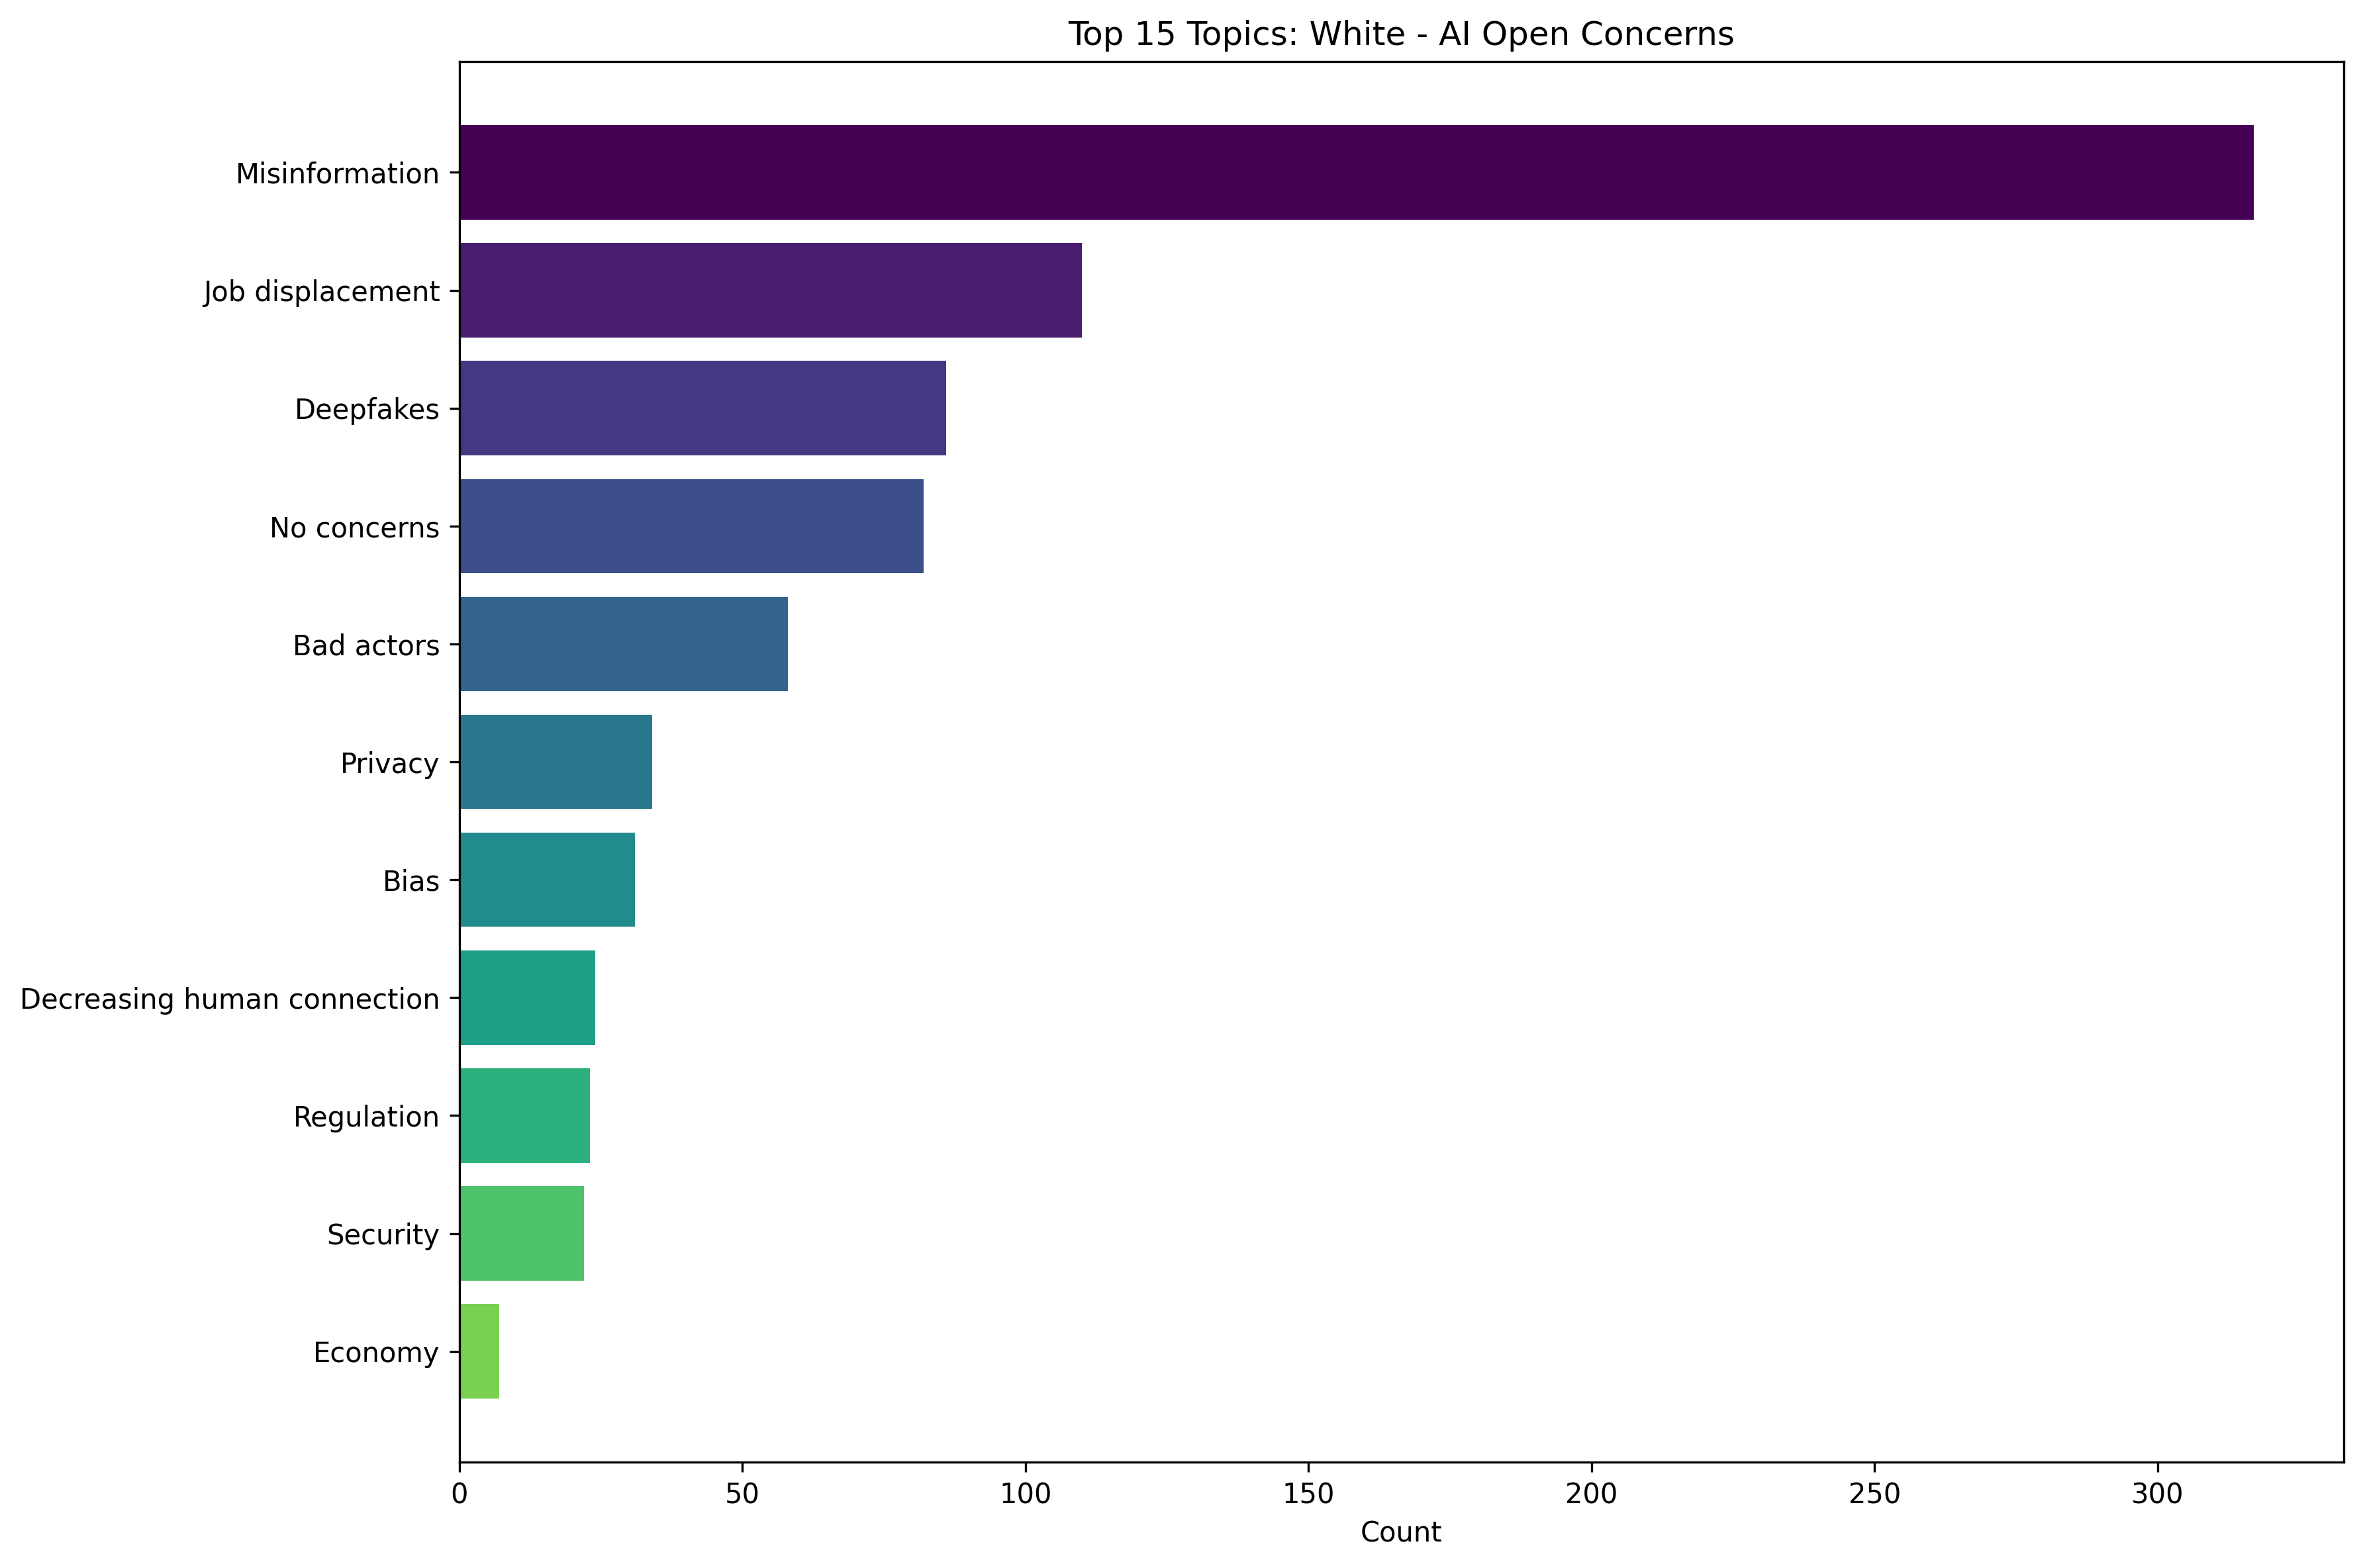
White AI Open Concerns Network
Network visualization of AI concerns from white respondents.
Top Concerns for White Respondents
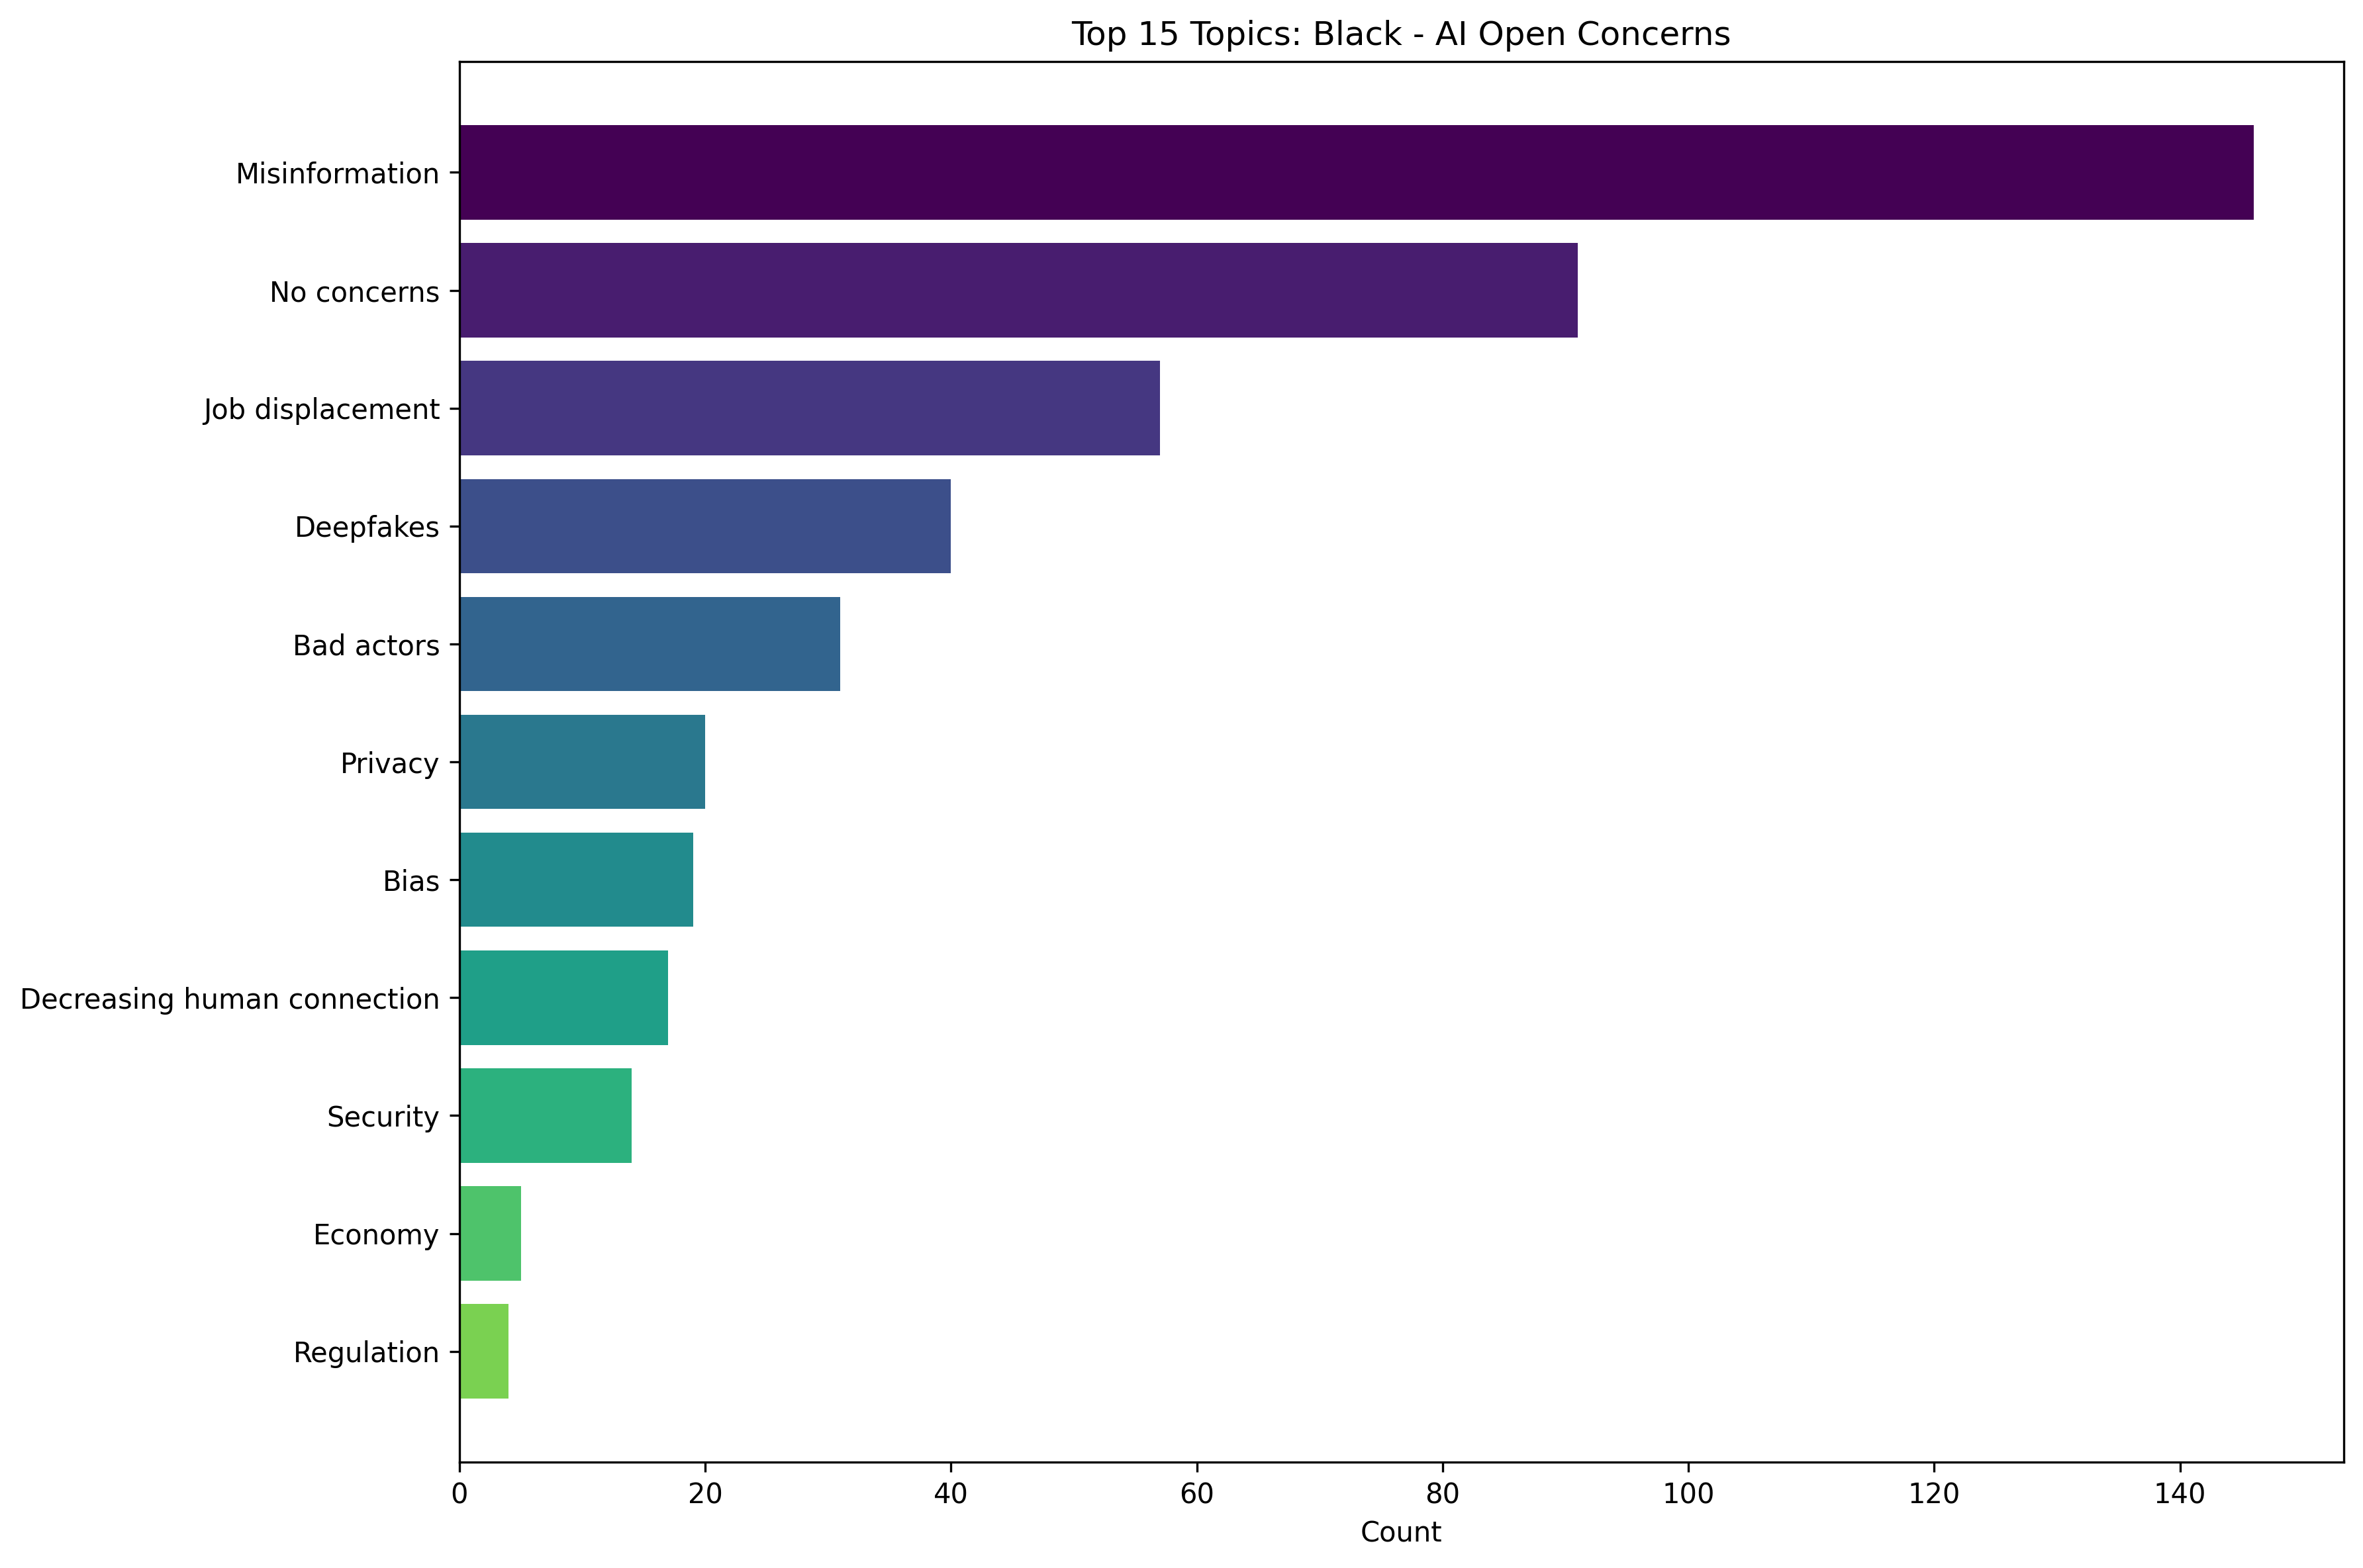
Black AI Open Concerns Network
Network visualization of AI concerns from Black respondents.
Top Concerns for Black Respondents
Race: Bot Factors
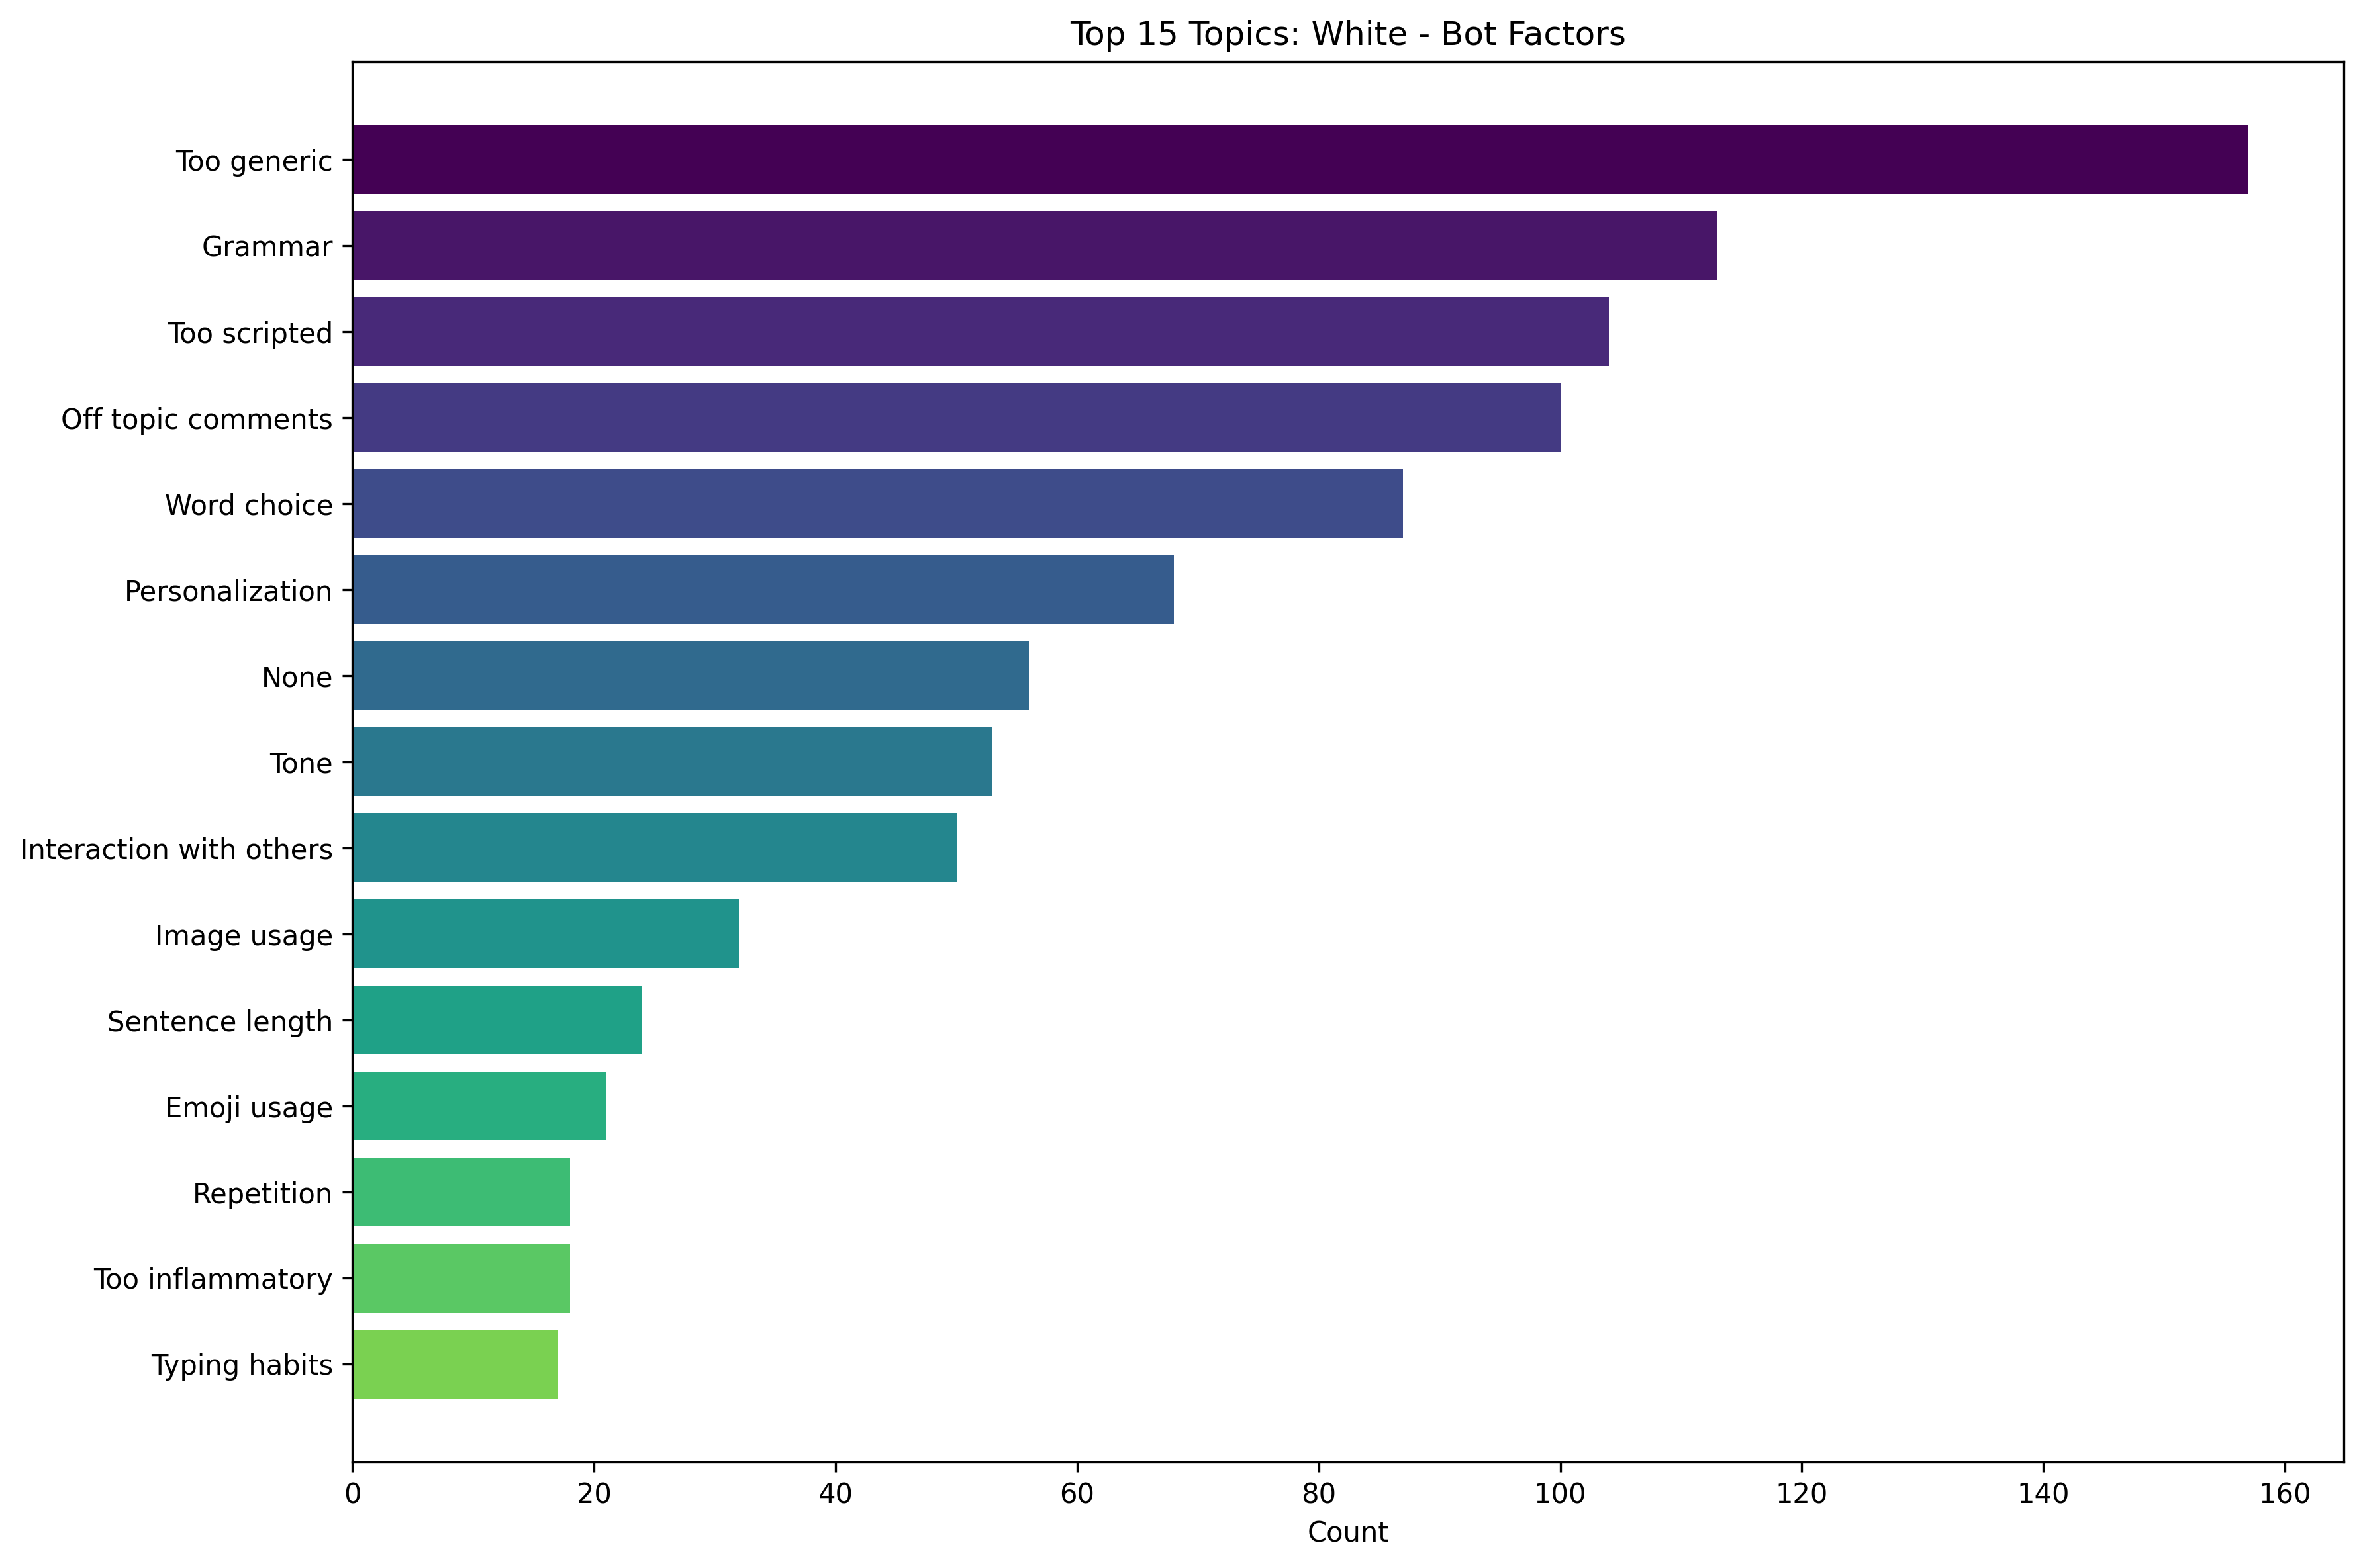
White Bot Factors Network
Network visualization of bot factors mentioned by white respondents.
Top Bot Factors for White Respondents
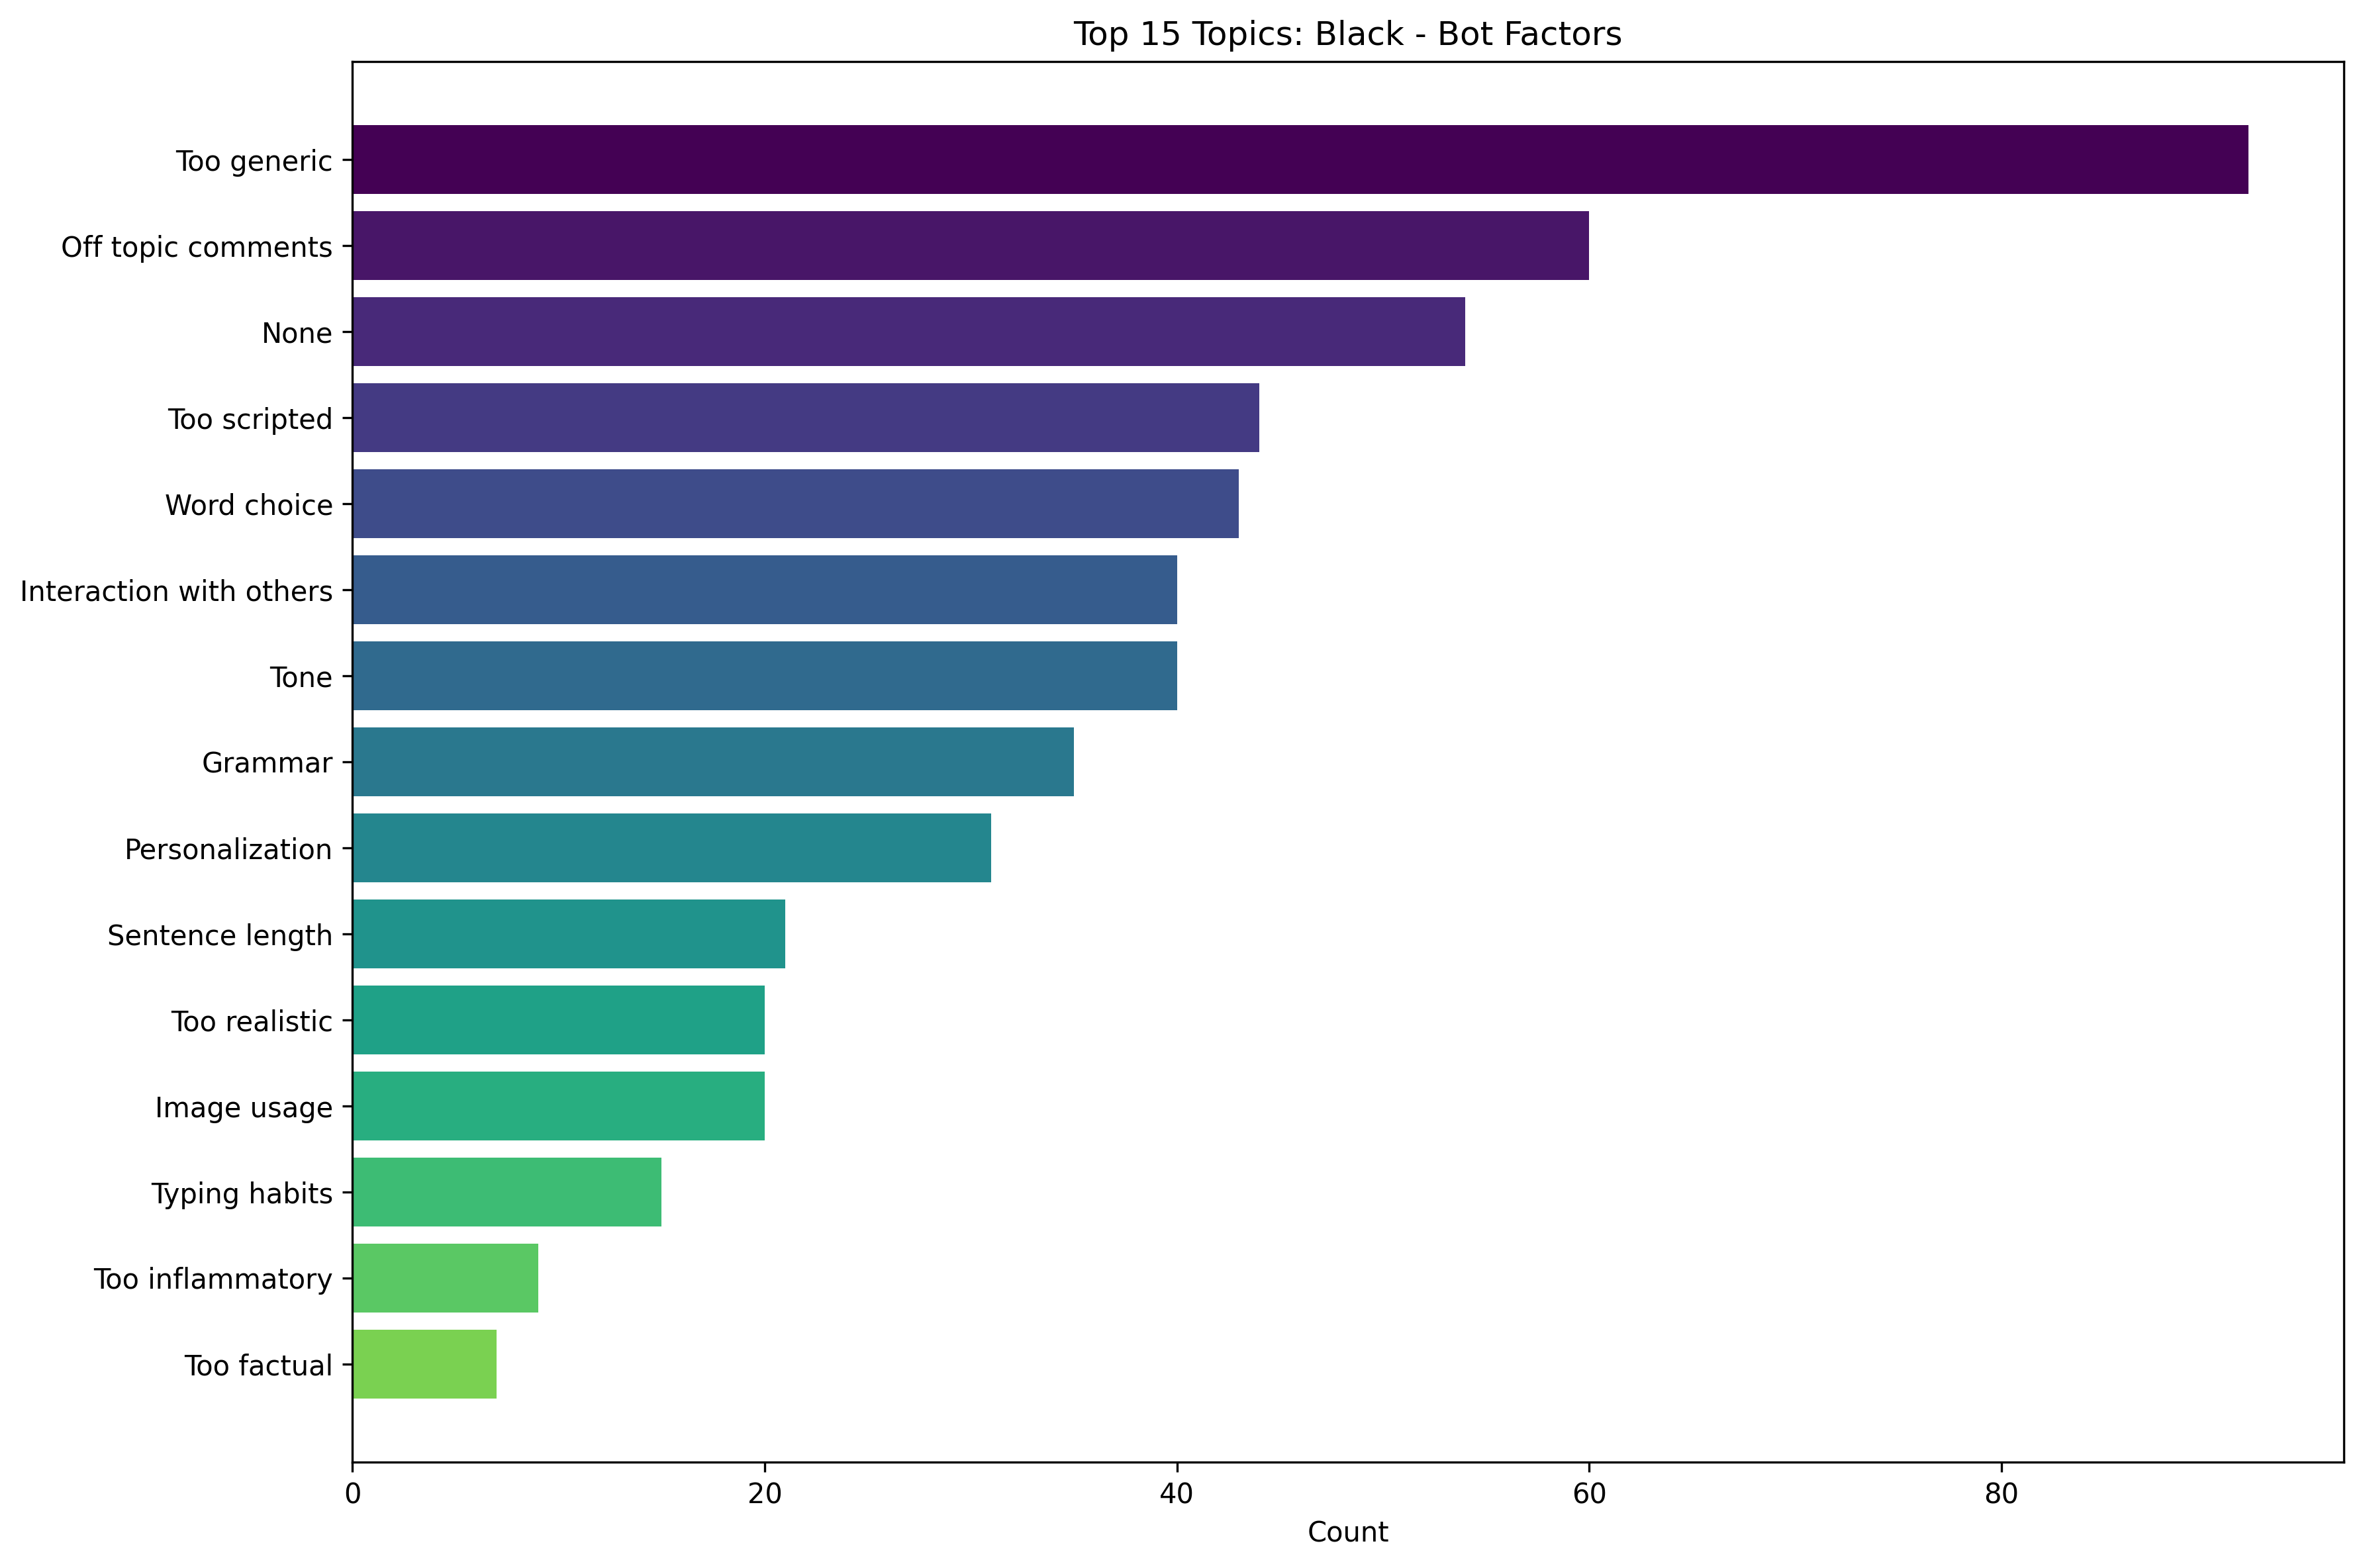
Black Bot Factors Network
Network visualization of bot factors mentioned by Black respondents.
Top Bot Factors for Black Respondents
Gender Comparative: AI Open Concerns
Interactive Network Visualization
This visualization highlights differences in AI concern patterns between male and female respondents. Blue nodes are topics more commonly mentioned by males, and red nodes are more commonly mentioned by females.
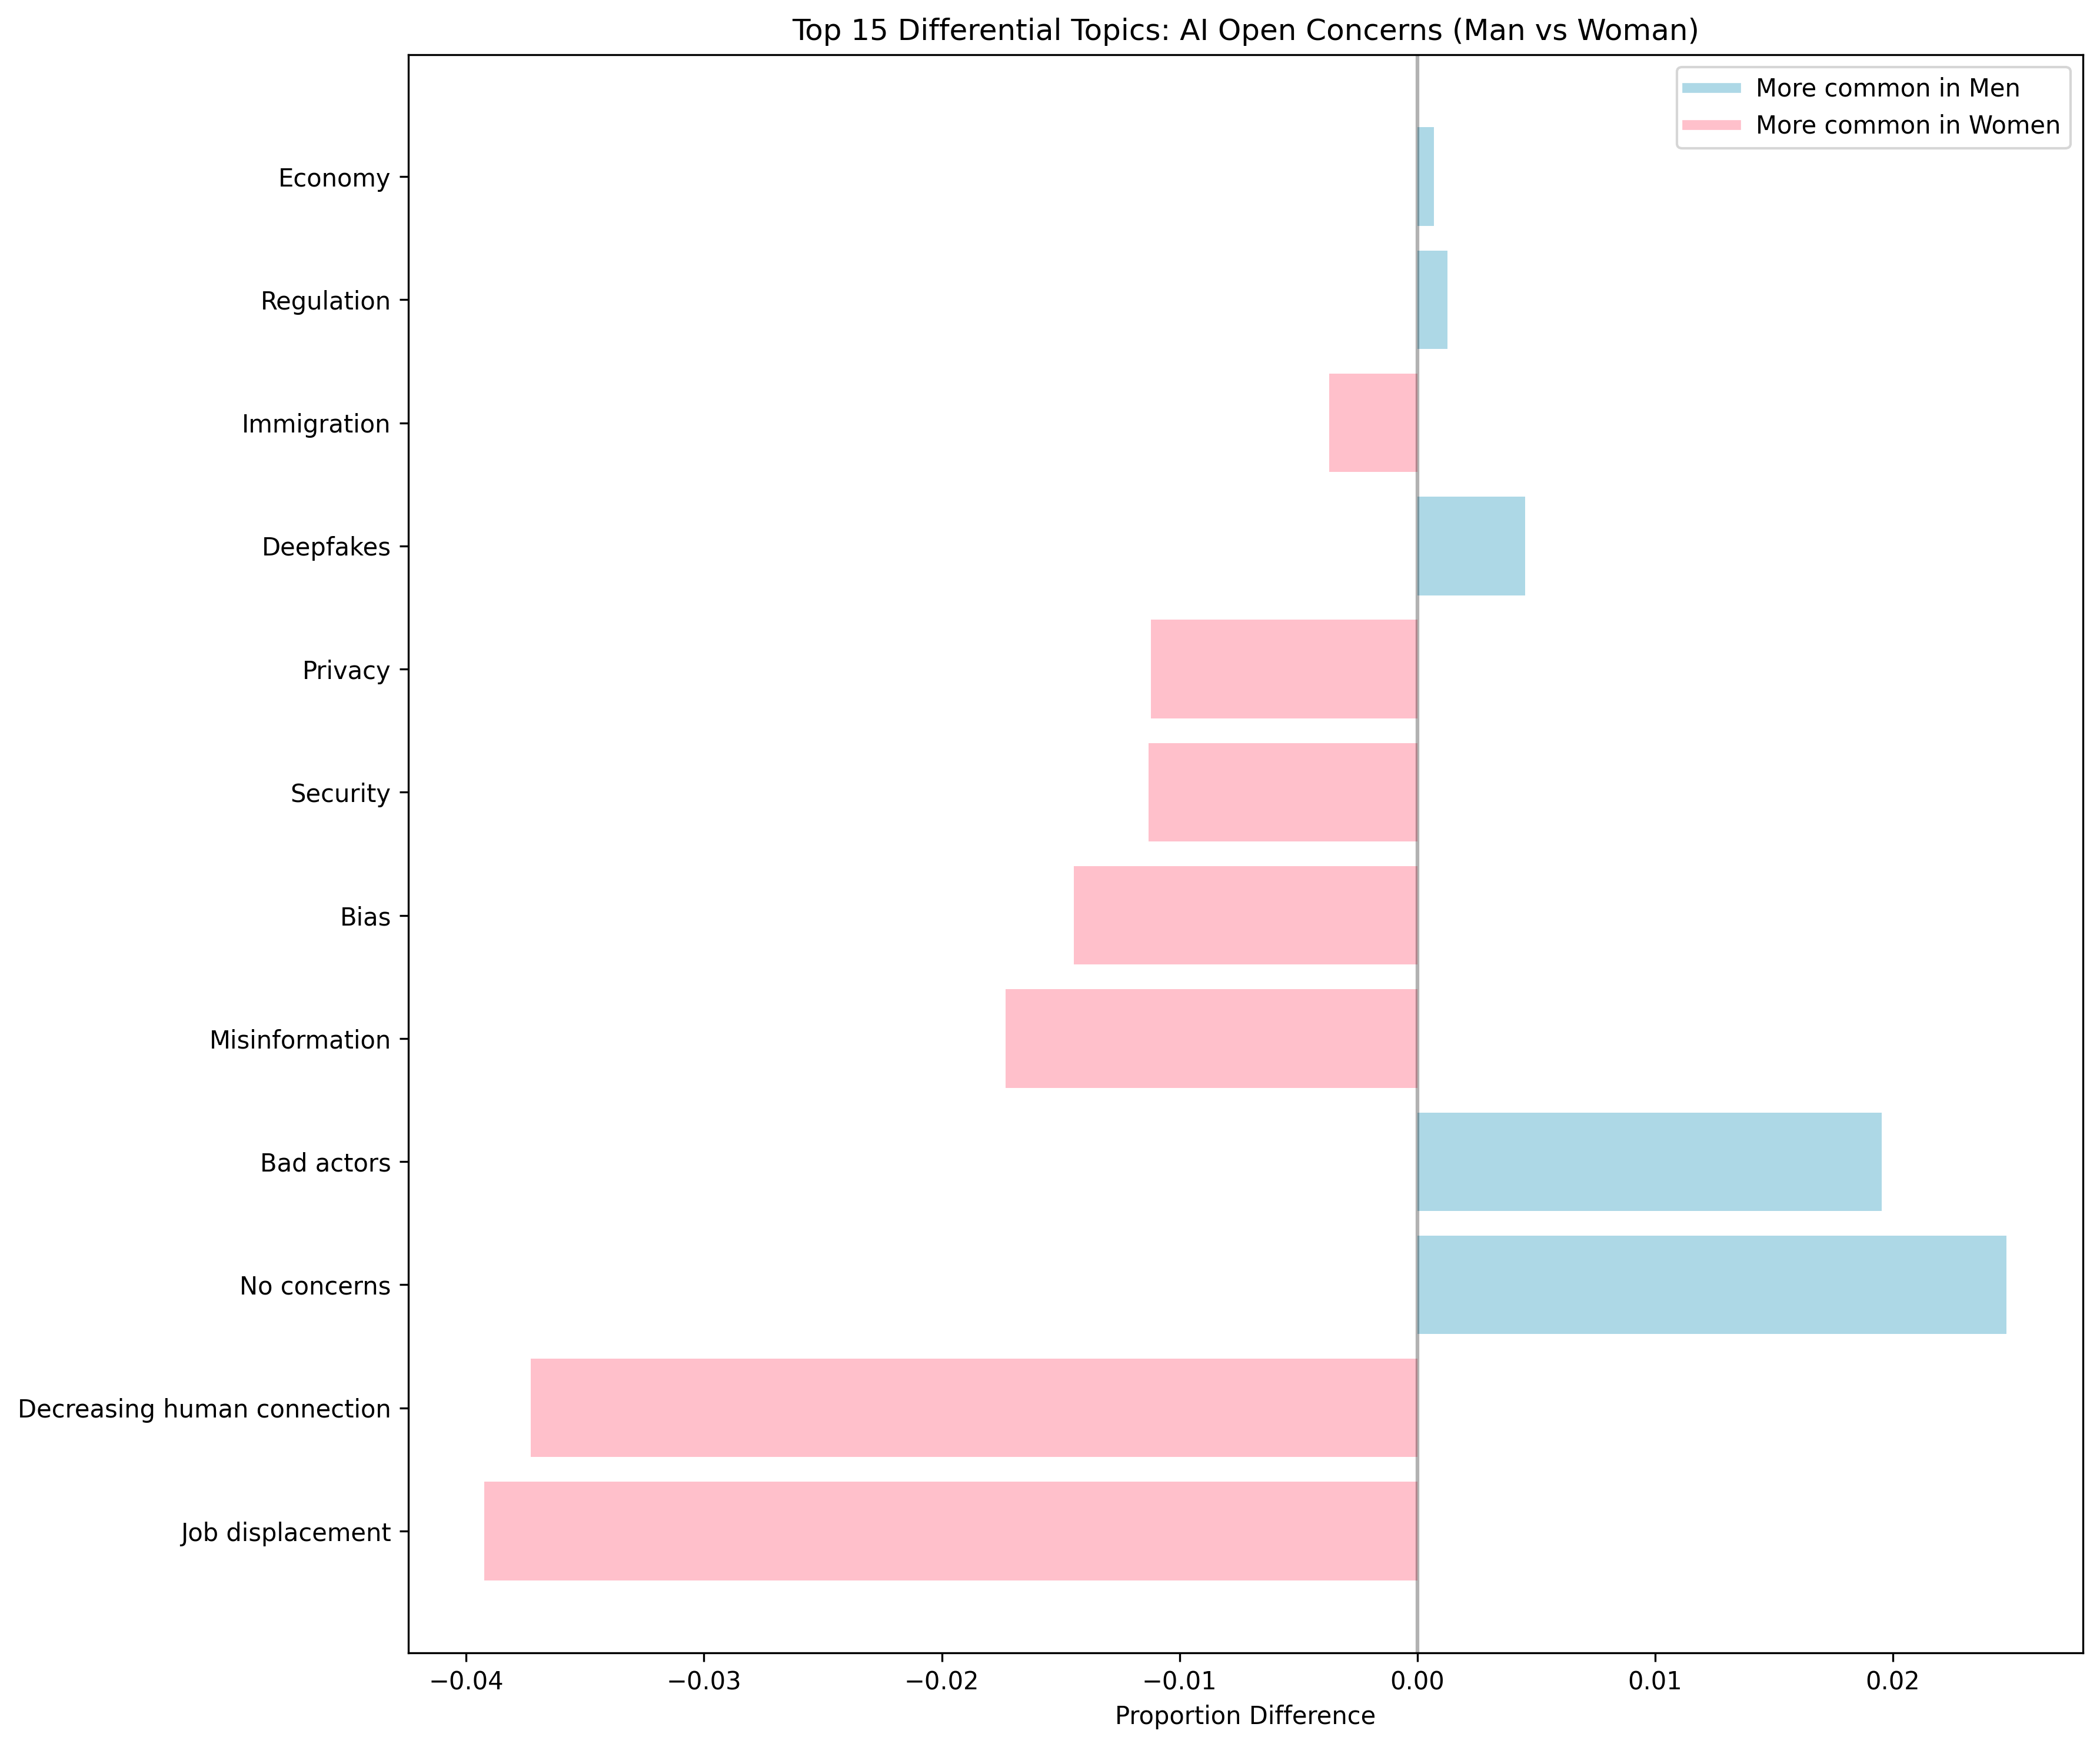
Differential Topics Chart
This chart shows the topics with the largest differences in usage between male and female respondents.
Gender Comparative: Bot Factors
Interactive Network Visualization
This visualization highlights differences in bot factor patterns between male and female respondents.
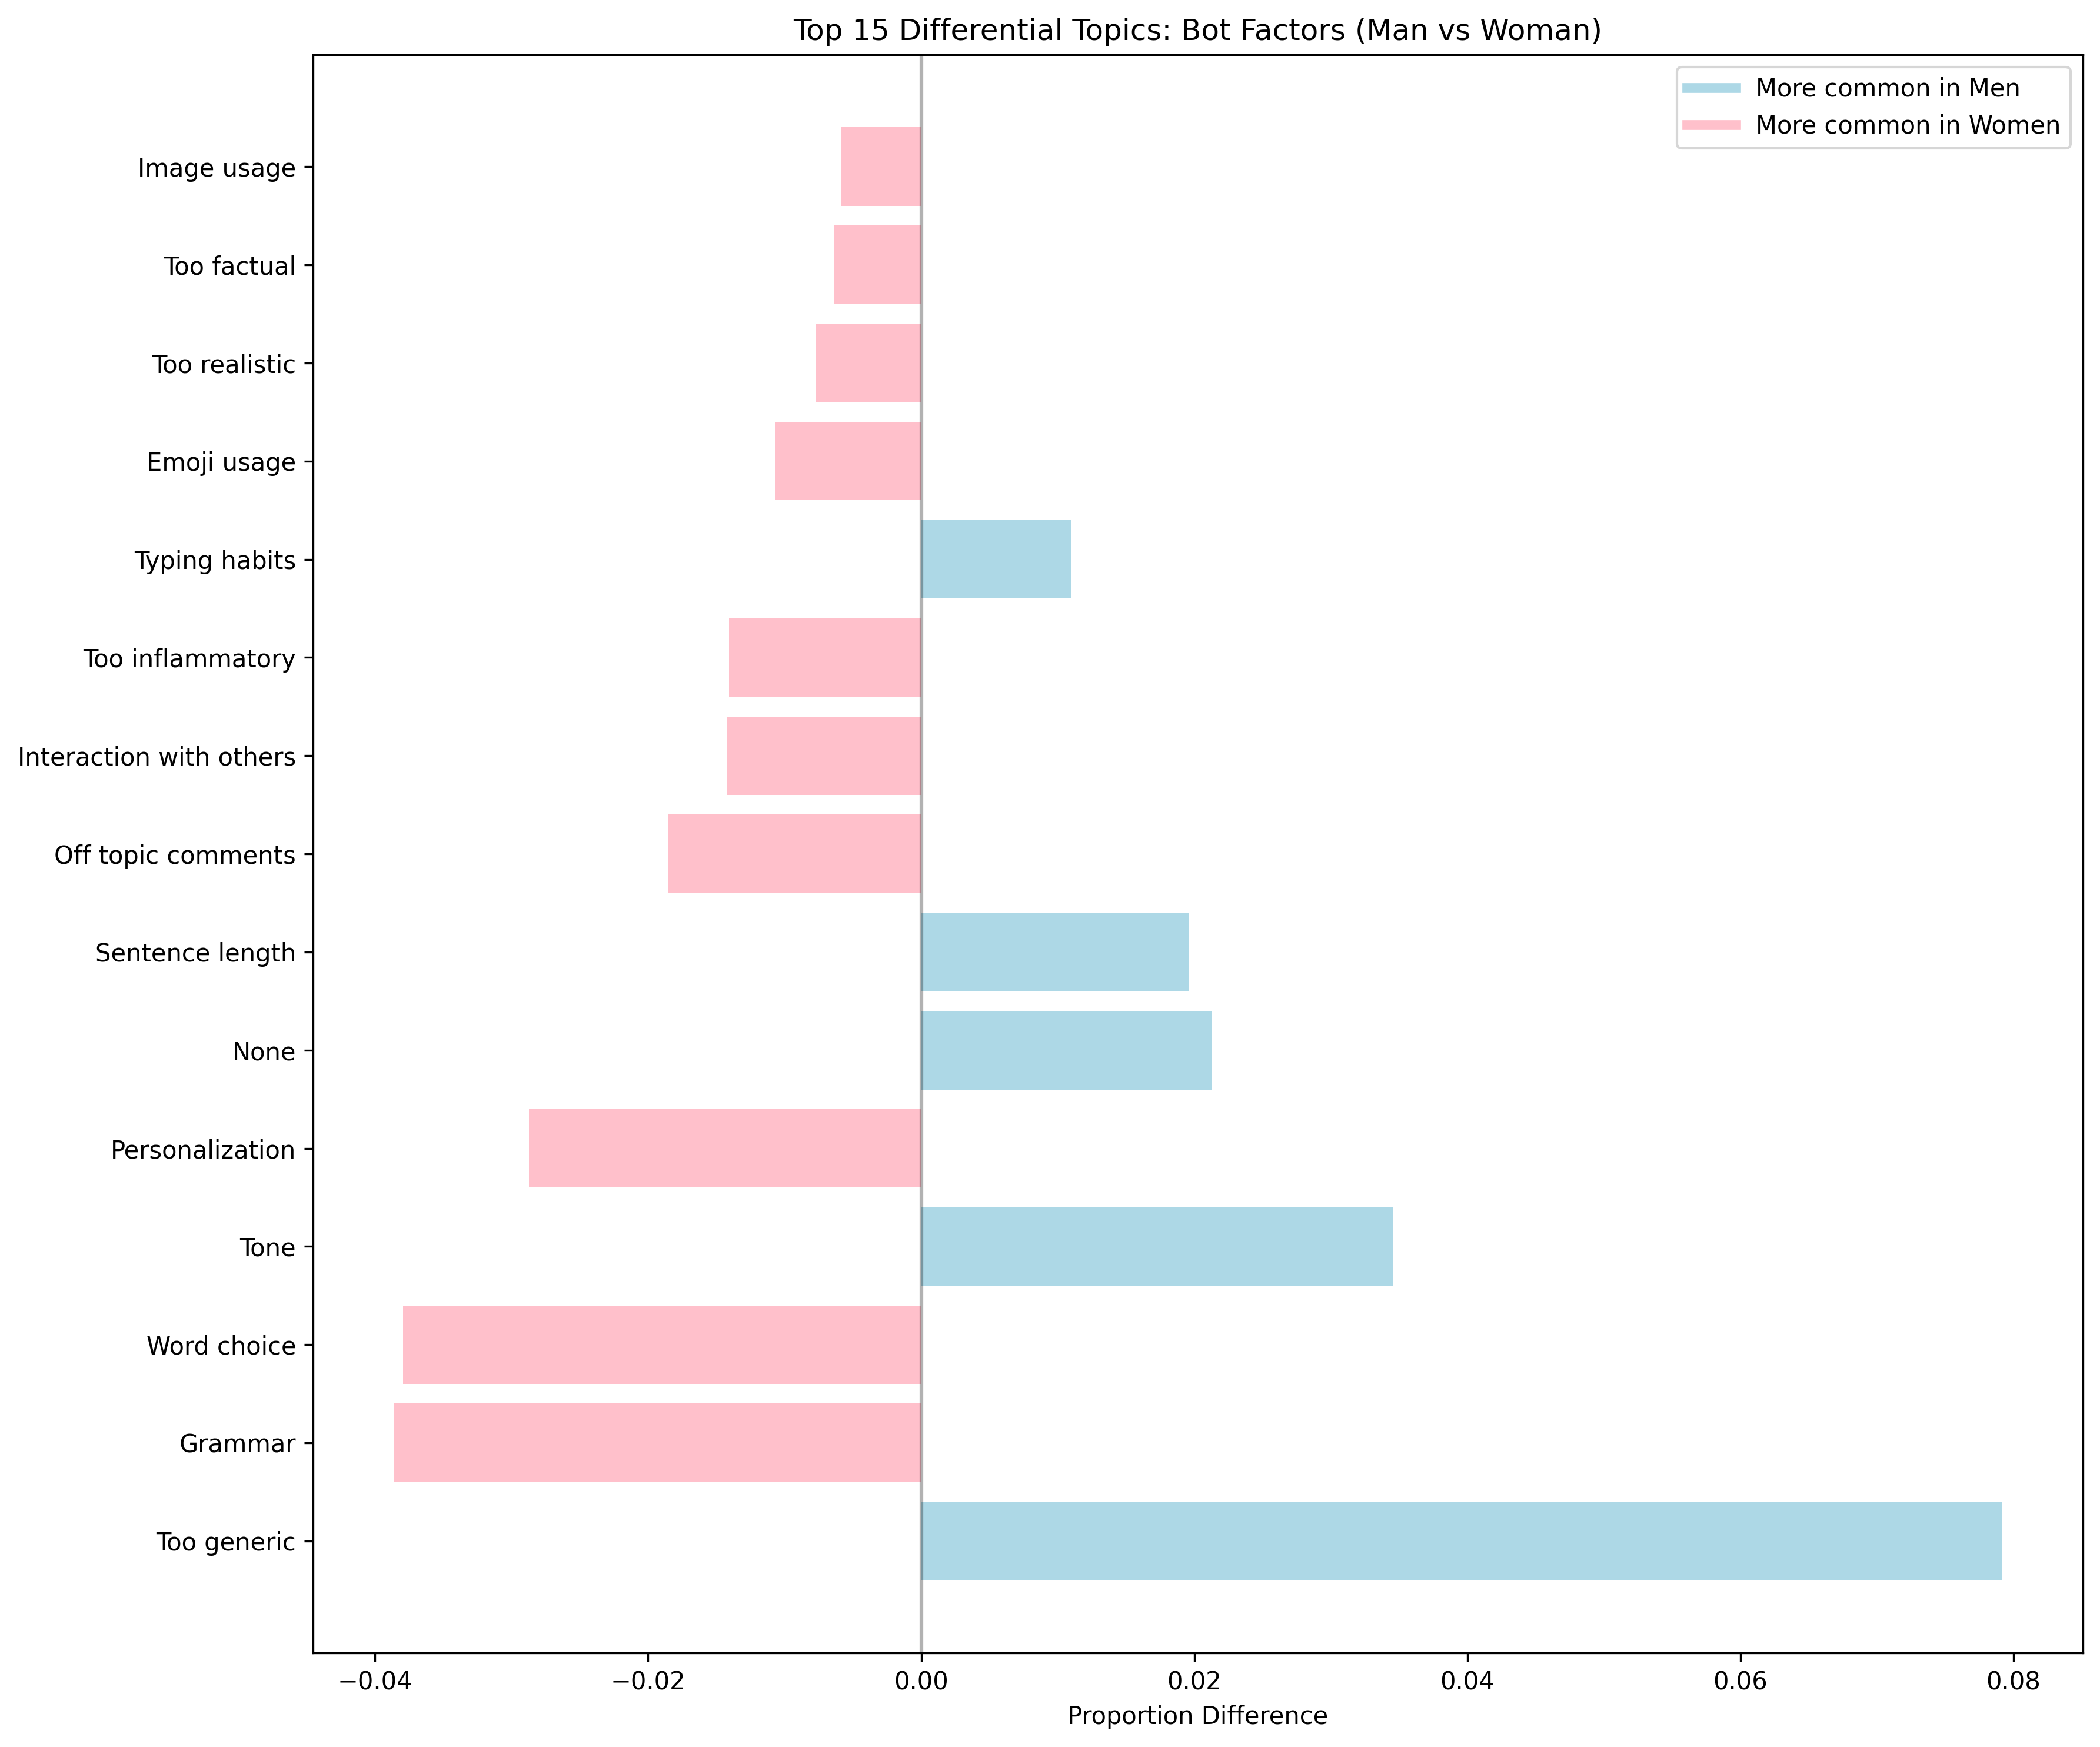
Differential Topics Chart
This chart shows the bot factors with the largest differences in usage between male and female respondents.
Race Comparative: AI Open Concerns
Interactive Network Visualization
This visualization highlights differences in AI concern patterns between white and Black respondents.
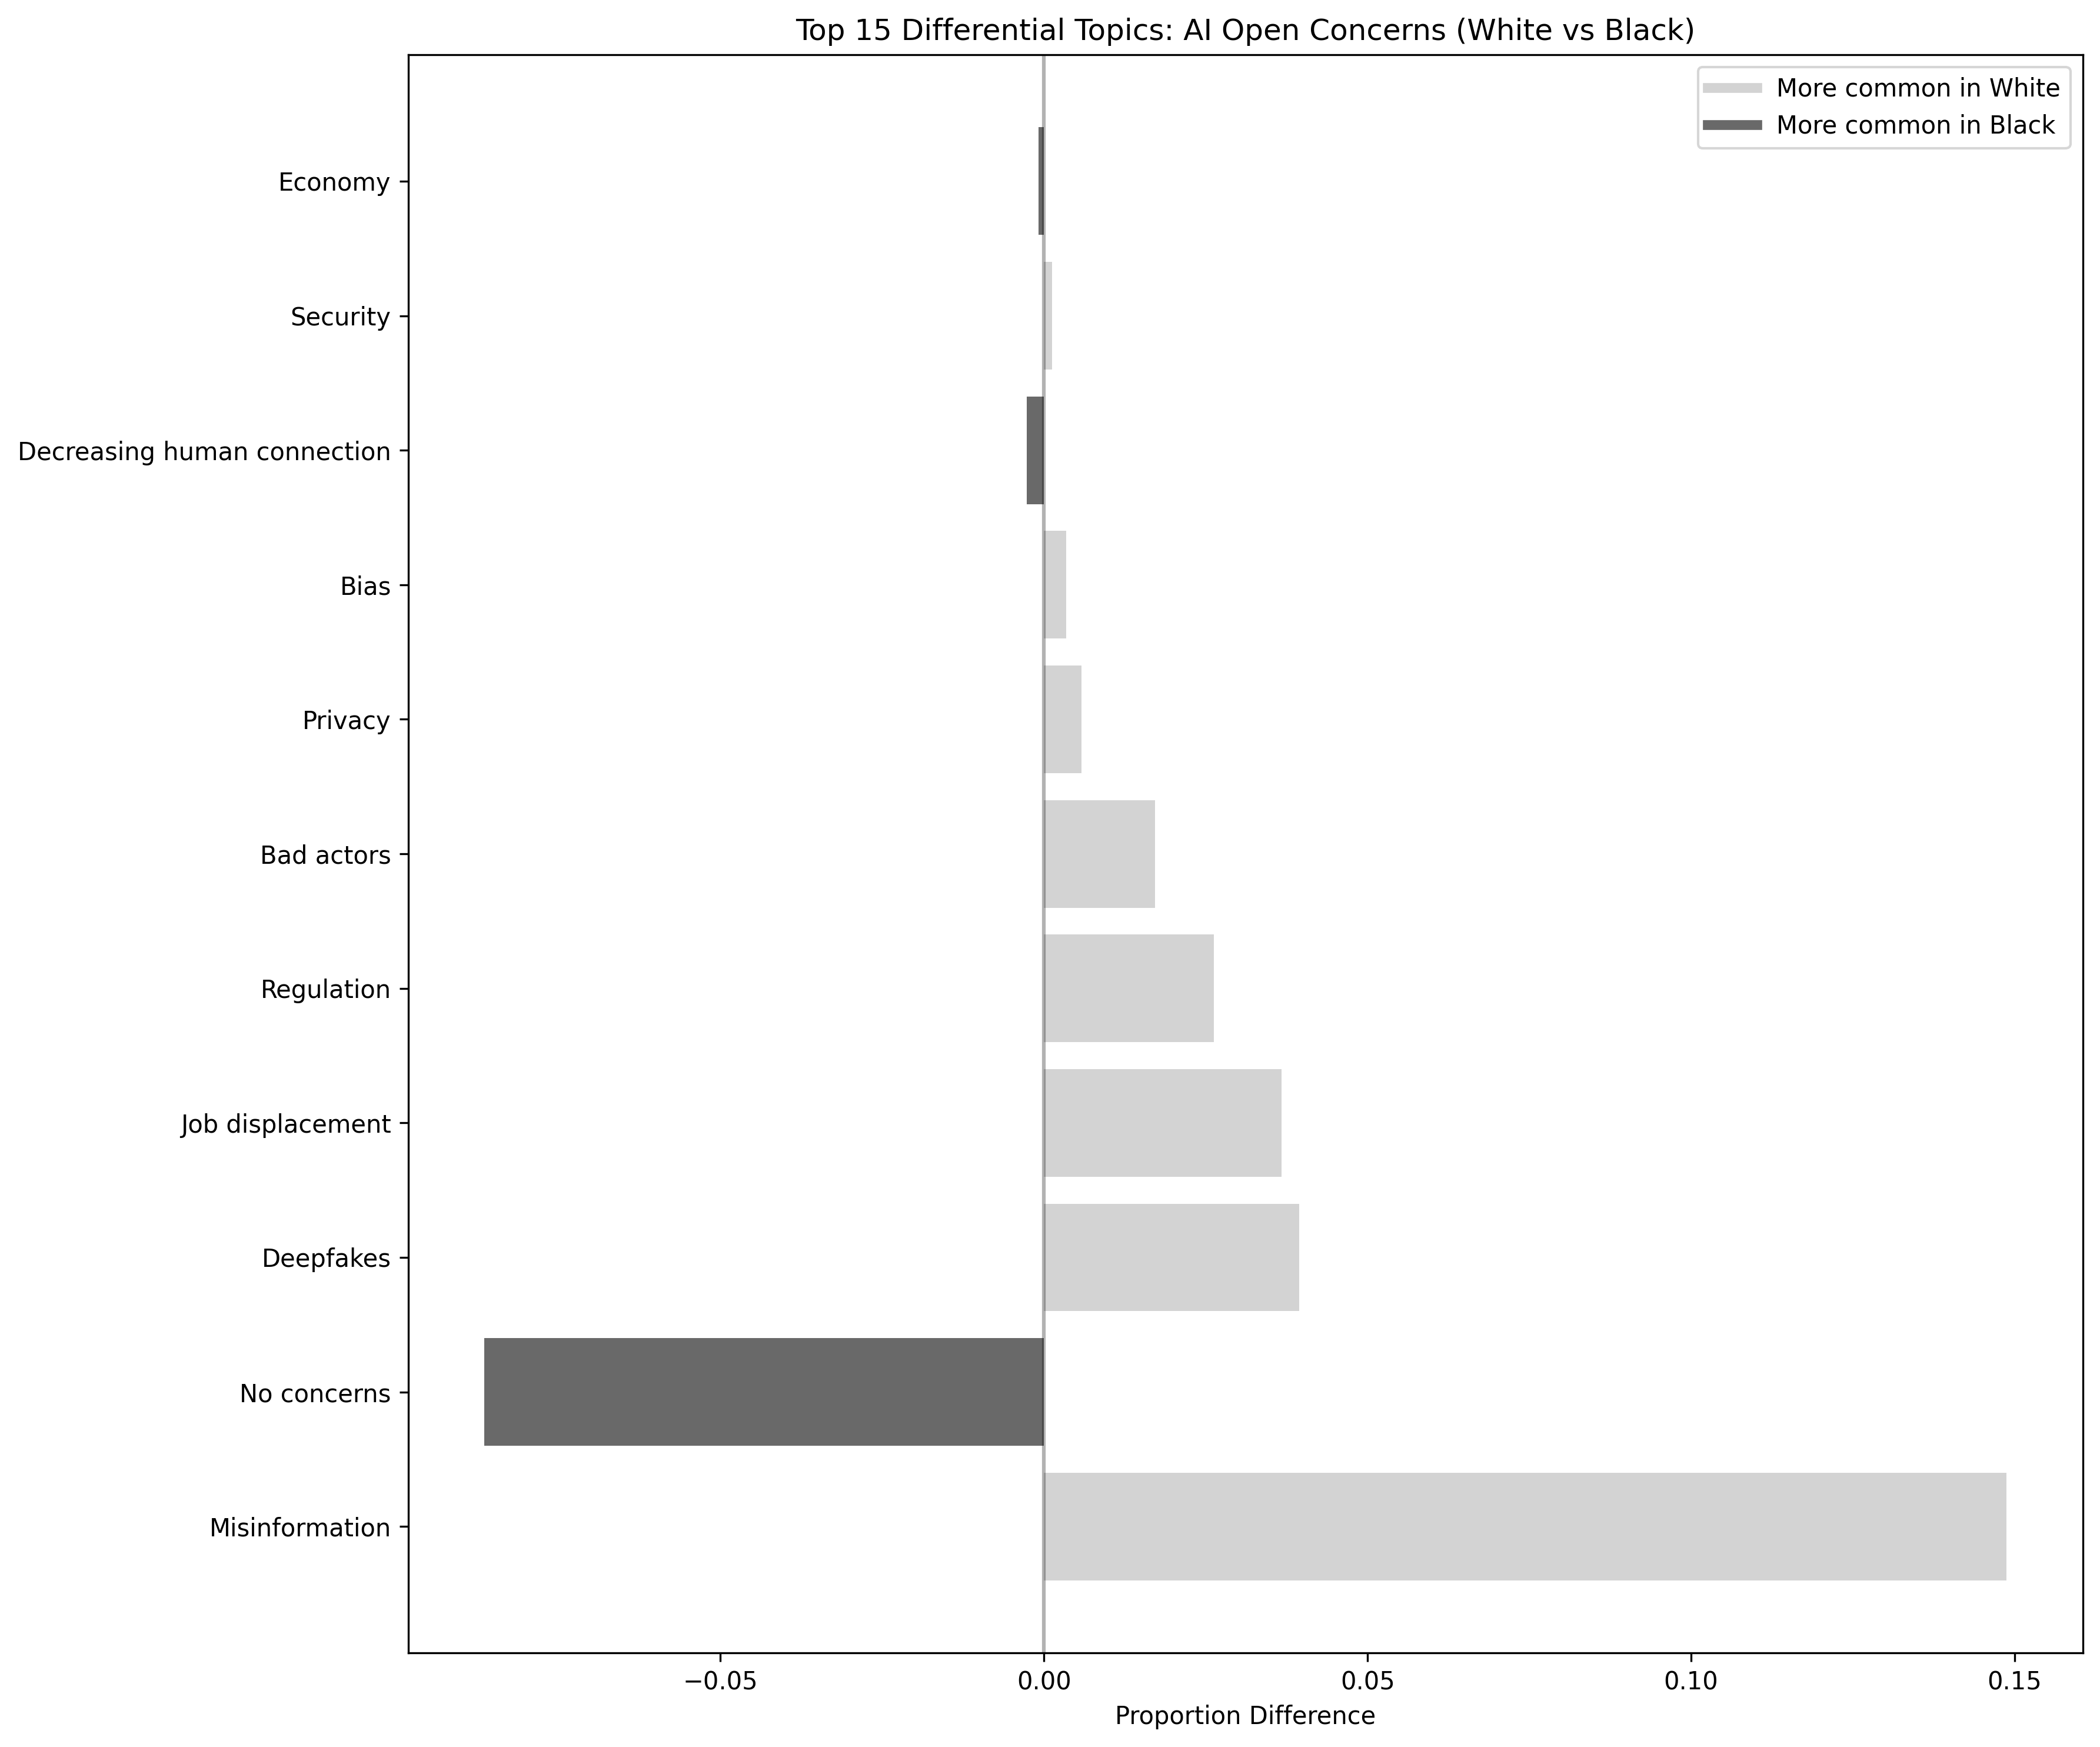
Differential Topics Chart
This chart shows the topics with the largest differences in usage between racial groups.
Race Comparative: Bot Factors
Interactive Network Visualization
This visualization highlights differences in bot factor patterns between white and Black respondents.
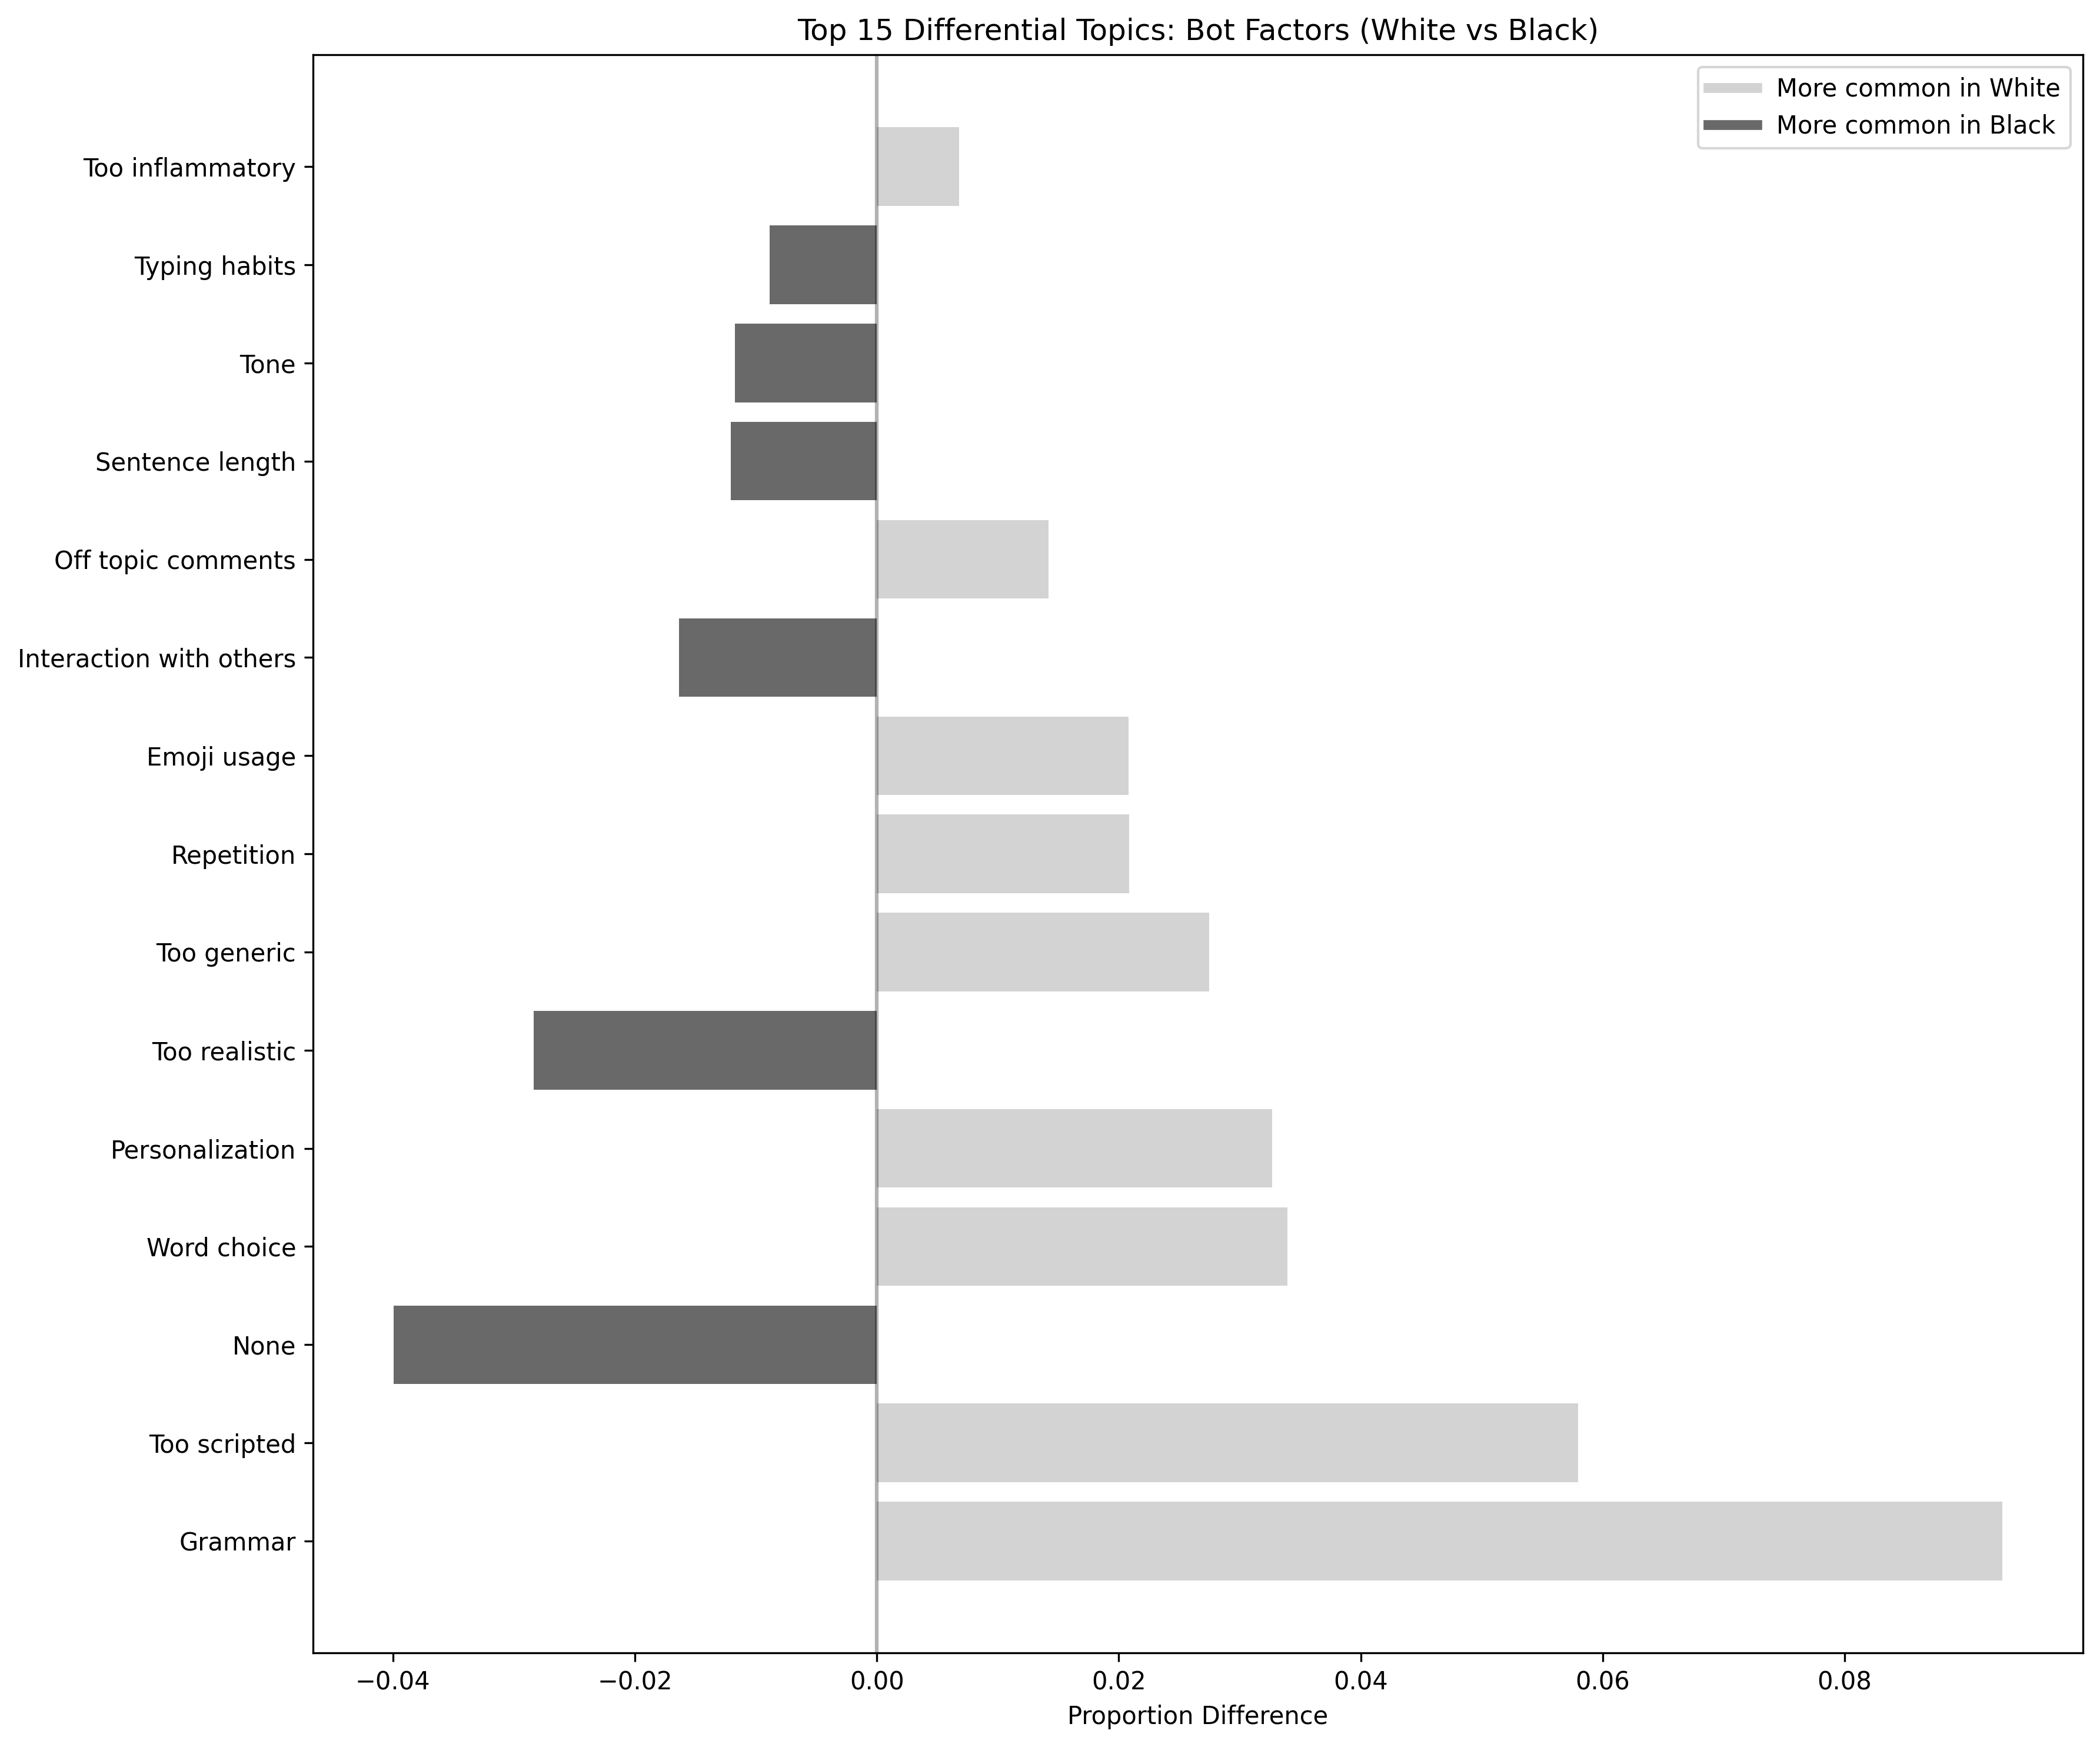
Differential Topics Chart
This chart shows the bot factors with the largest differences in usage between racial groups.
Political Comparative: AI Open Concerns
Interactive Network Visualization
This visualization highlights differences in AI concern patterns between Democrat and Republican respondents. Blue nodes are topics more commonly mentioned by Democrats, and red nodes are more commonly mentioned by Republicans.
Differential Topics Chart
This chart shows the topics with the largest differences in usage between Democrat and Republican respondents.
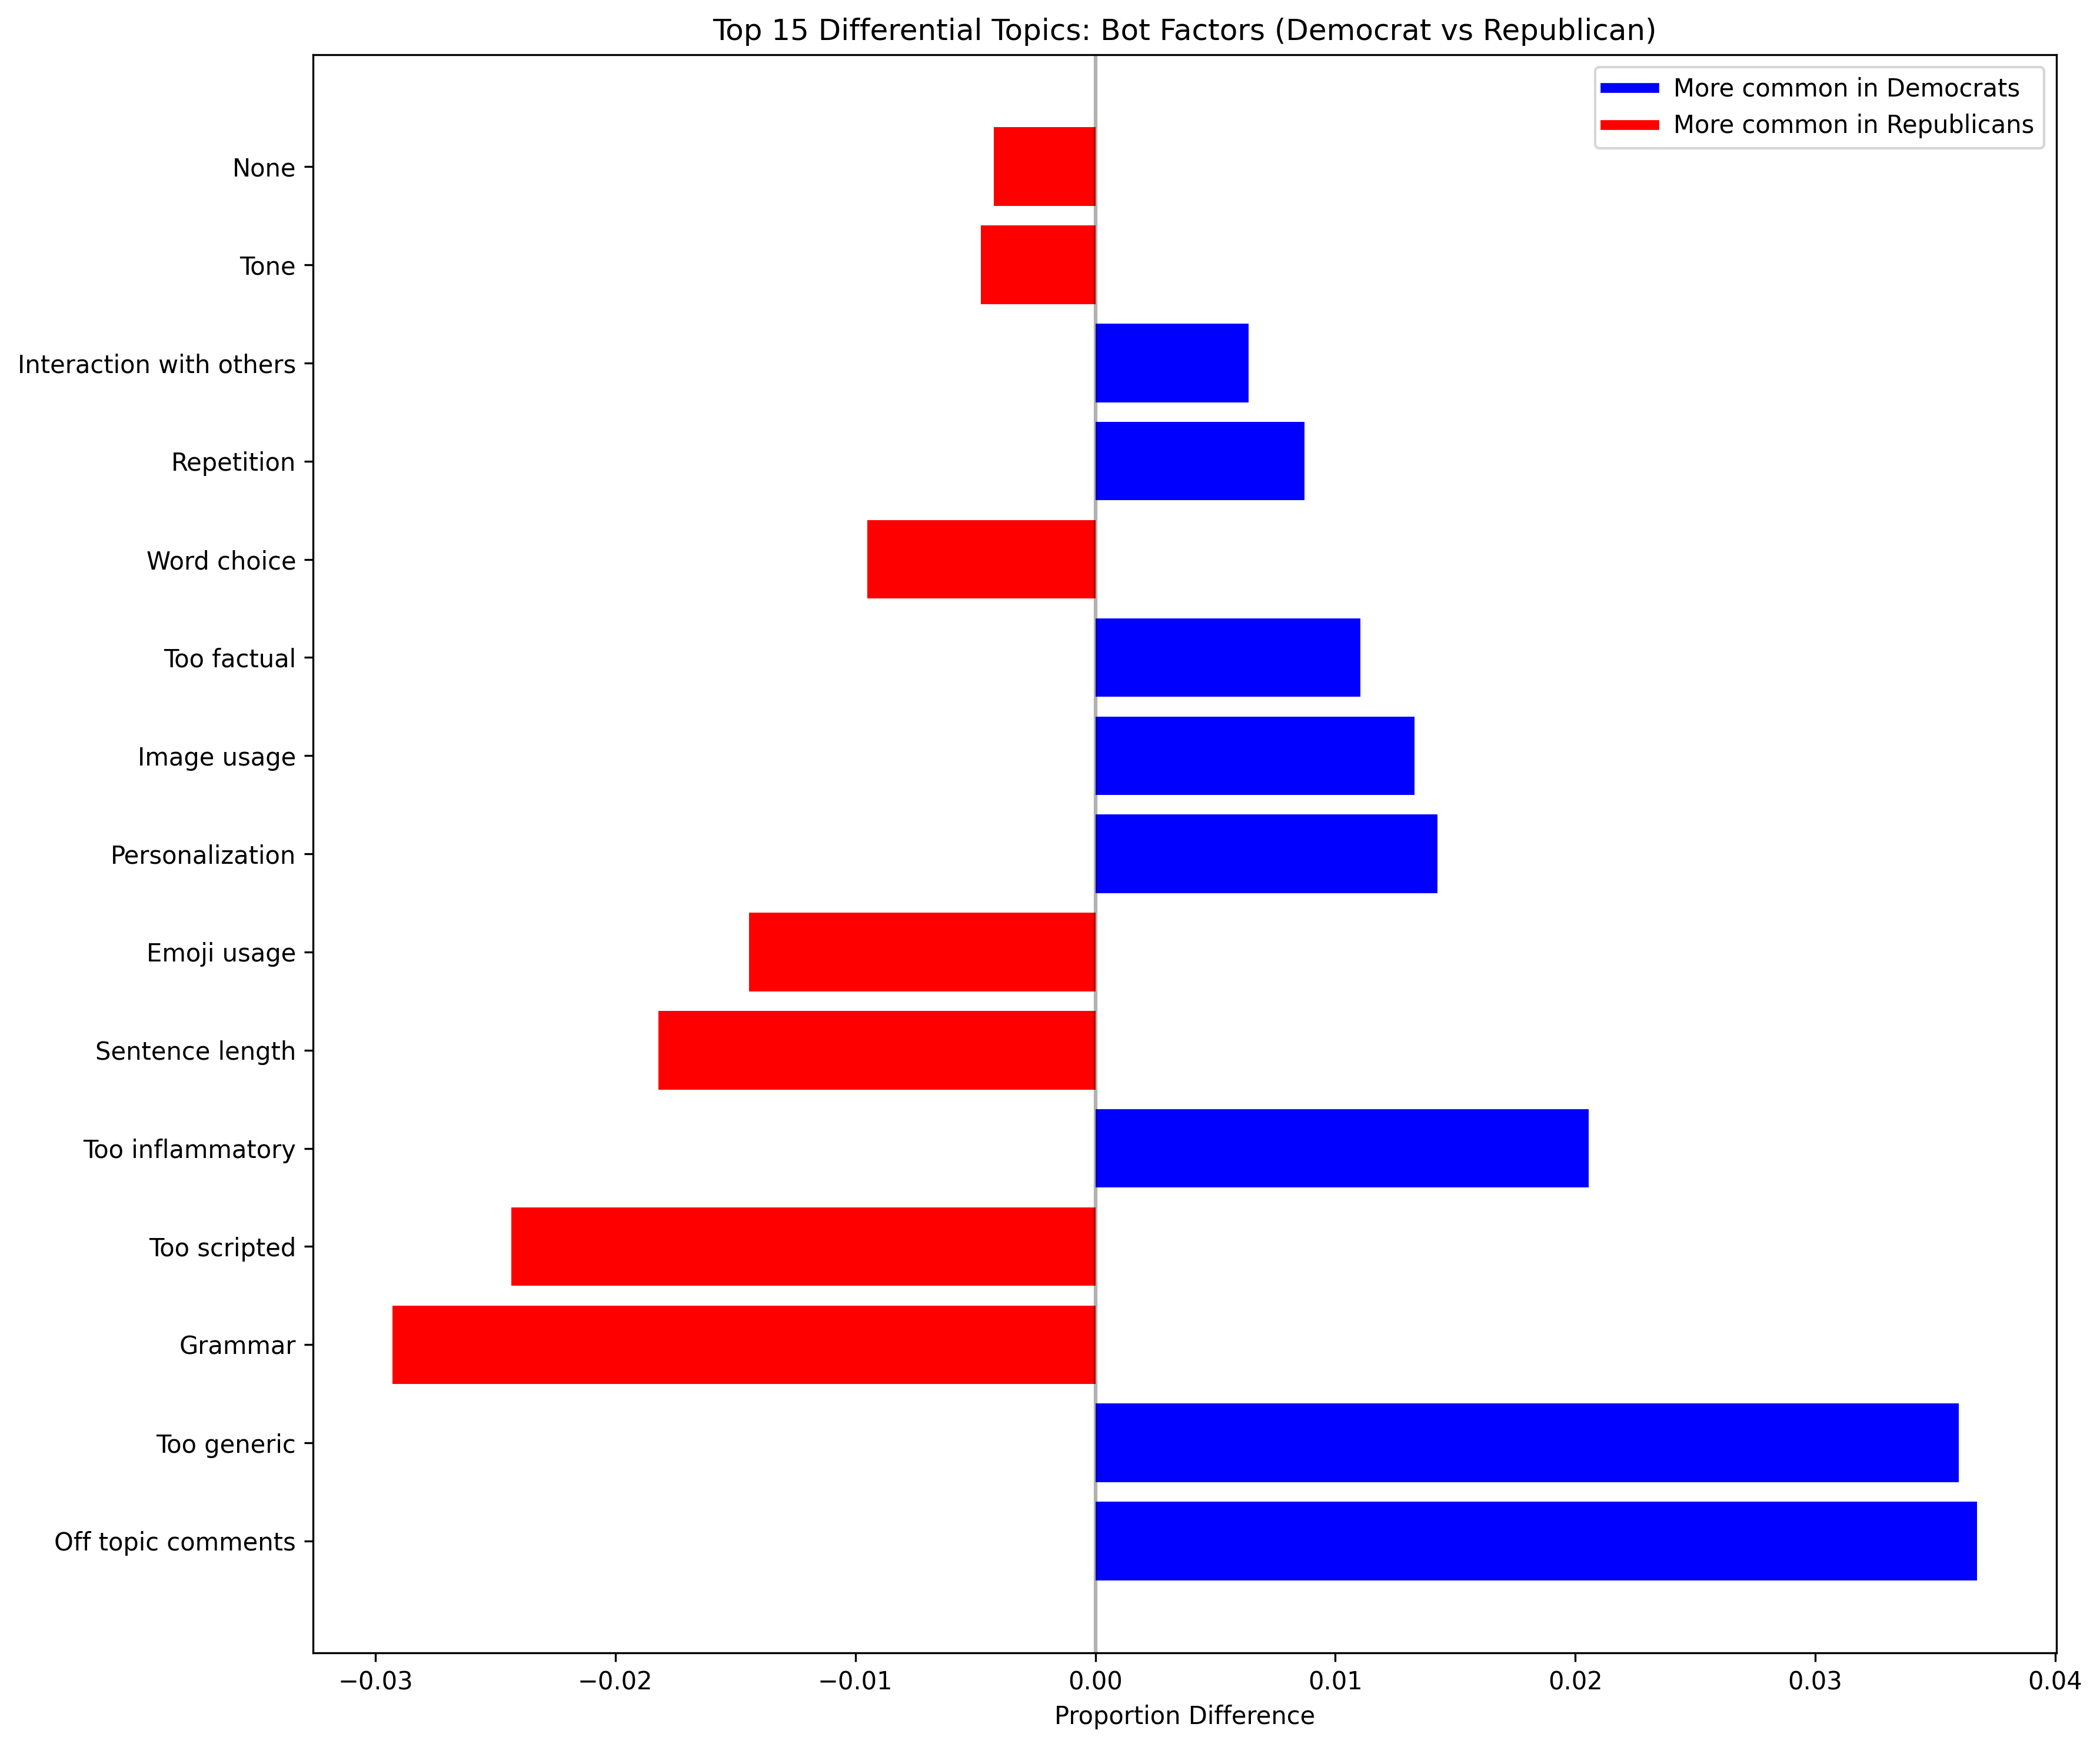
Political Comparative: Bot Factors
Interactive Network Visualization
This visualization highlights differences in bot factor patterns between Democrat and Republican respondents. Blue nodes are factors more commonly mentioned by Democrats, and red nodes are more commonly mentioned by Republicans.
Differential Topics Chart
This chart shows the bot factors with the largest differences in usage between Democrat and Republican respondents.
Gender Comparative: AI Open Concerns
Interactive Network Visualization
This visualization highlights differences in AI concern patterns between male and female respondents. Blue nodes are topics more commonly mentioned by males, and red nodes are more commonly mentioned by females.
Differential Topics Chart
This chart shows the topics with the largest differences in usage between male and female respondents.
Gender Comparative: Bot Factors
Interactive Network Visualization
This visualization highlights differences in bot factor patterns between male and female respondents.
Differential Topics Chart
This chart shows the bot factors with the largest differences in usage between male and female respondents.
Race Comparative: AI Open Concerns
Interactive Network Visualization
This visualization highlights differences in AI concern patterns between white and Black respondents.
Differential Topics Chart
This chart shows the topics with the largest differences in usage between racial groups.
Race Comparative: Bot Factors
Interactive Network Visualization
This visualization highlights differences in bot factor patterns between white and Black respondents.
Differential Topics Chart
This chart shows the bot factors with the largest differences in usage between racial groups.
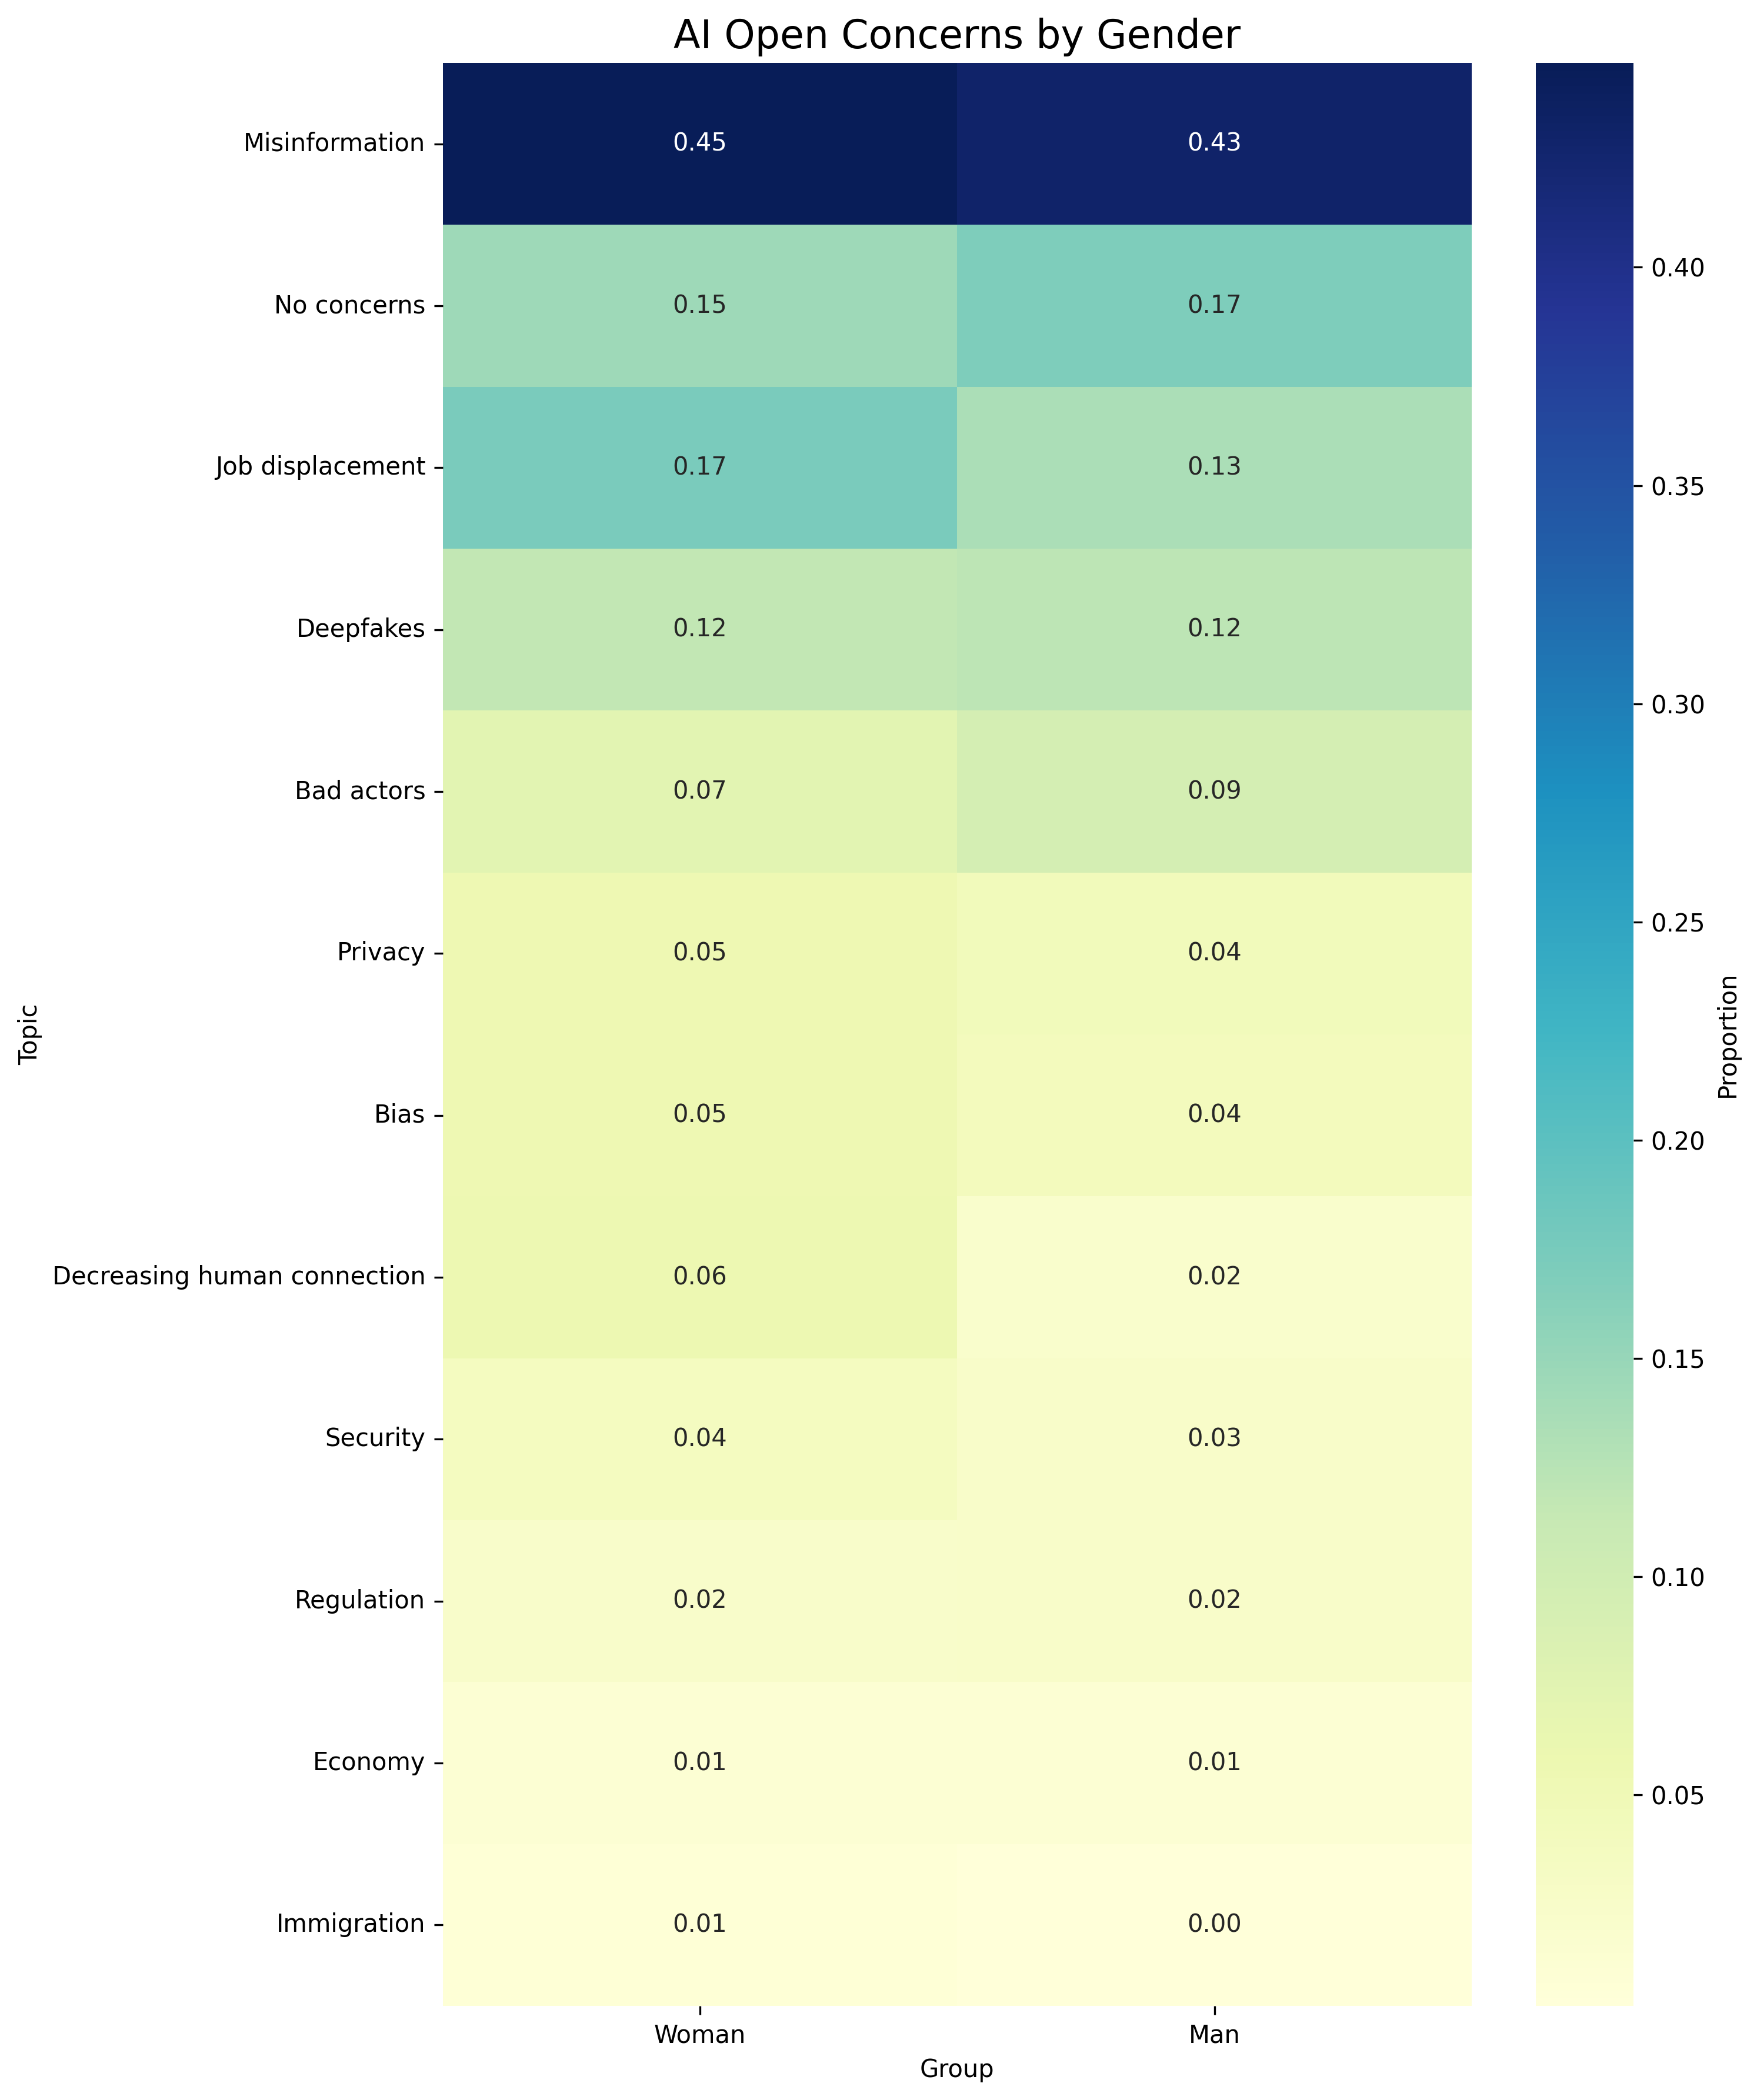
Gender Heatmaps
AI Open Concerns by Gender
This heatmap shows the proportion of respondents by gender who mentioned each topic.
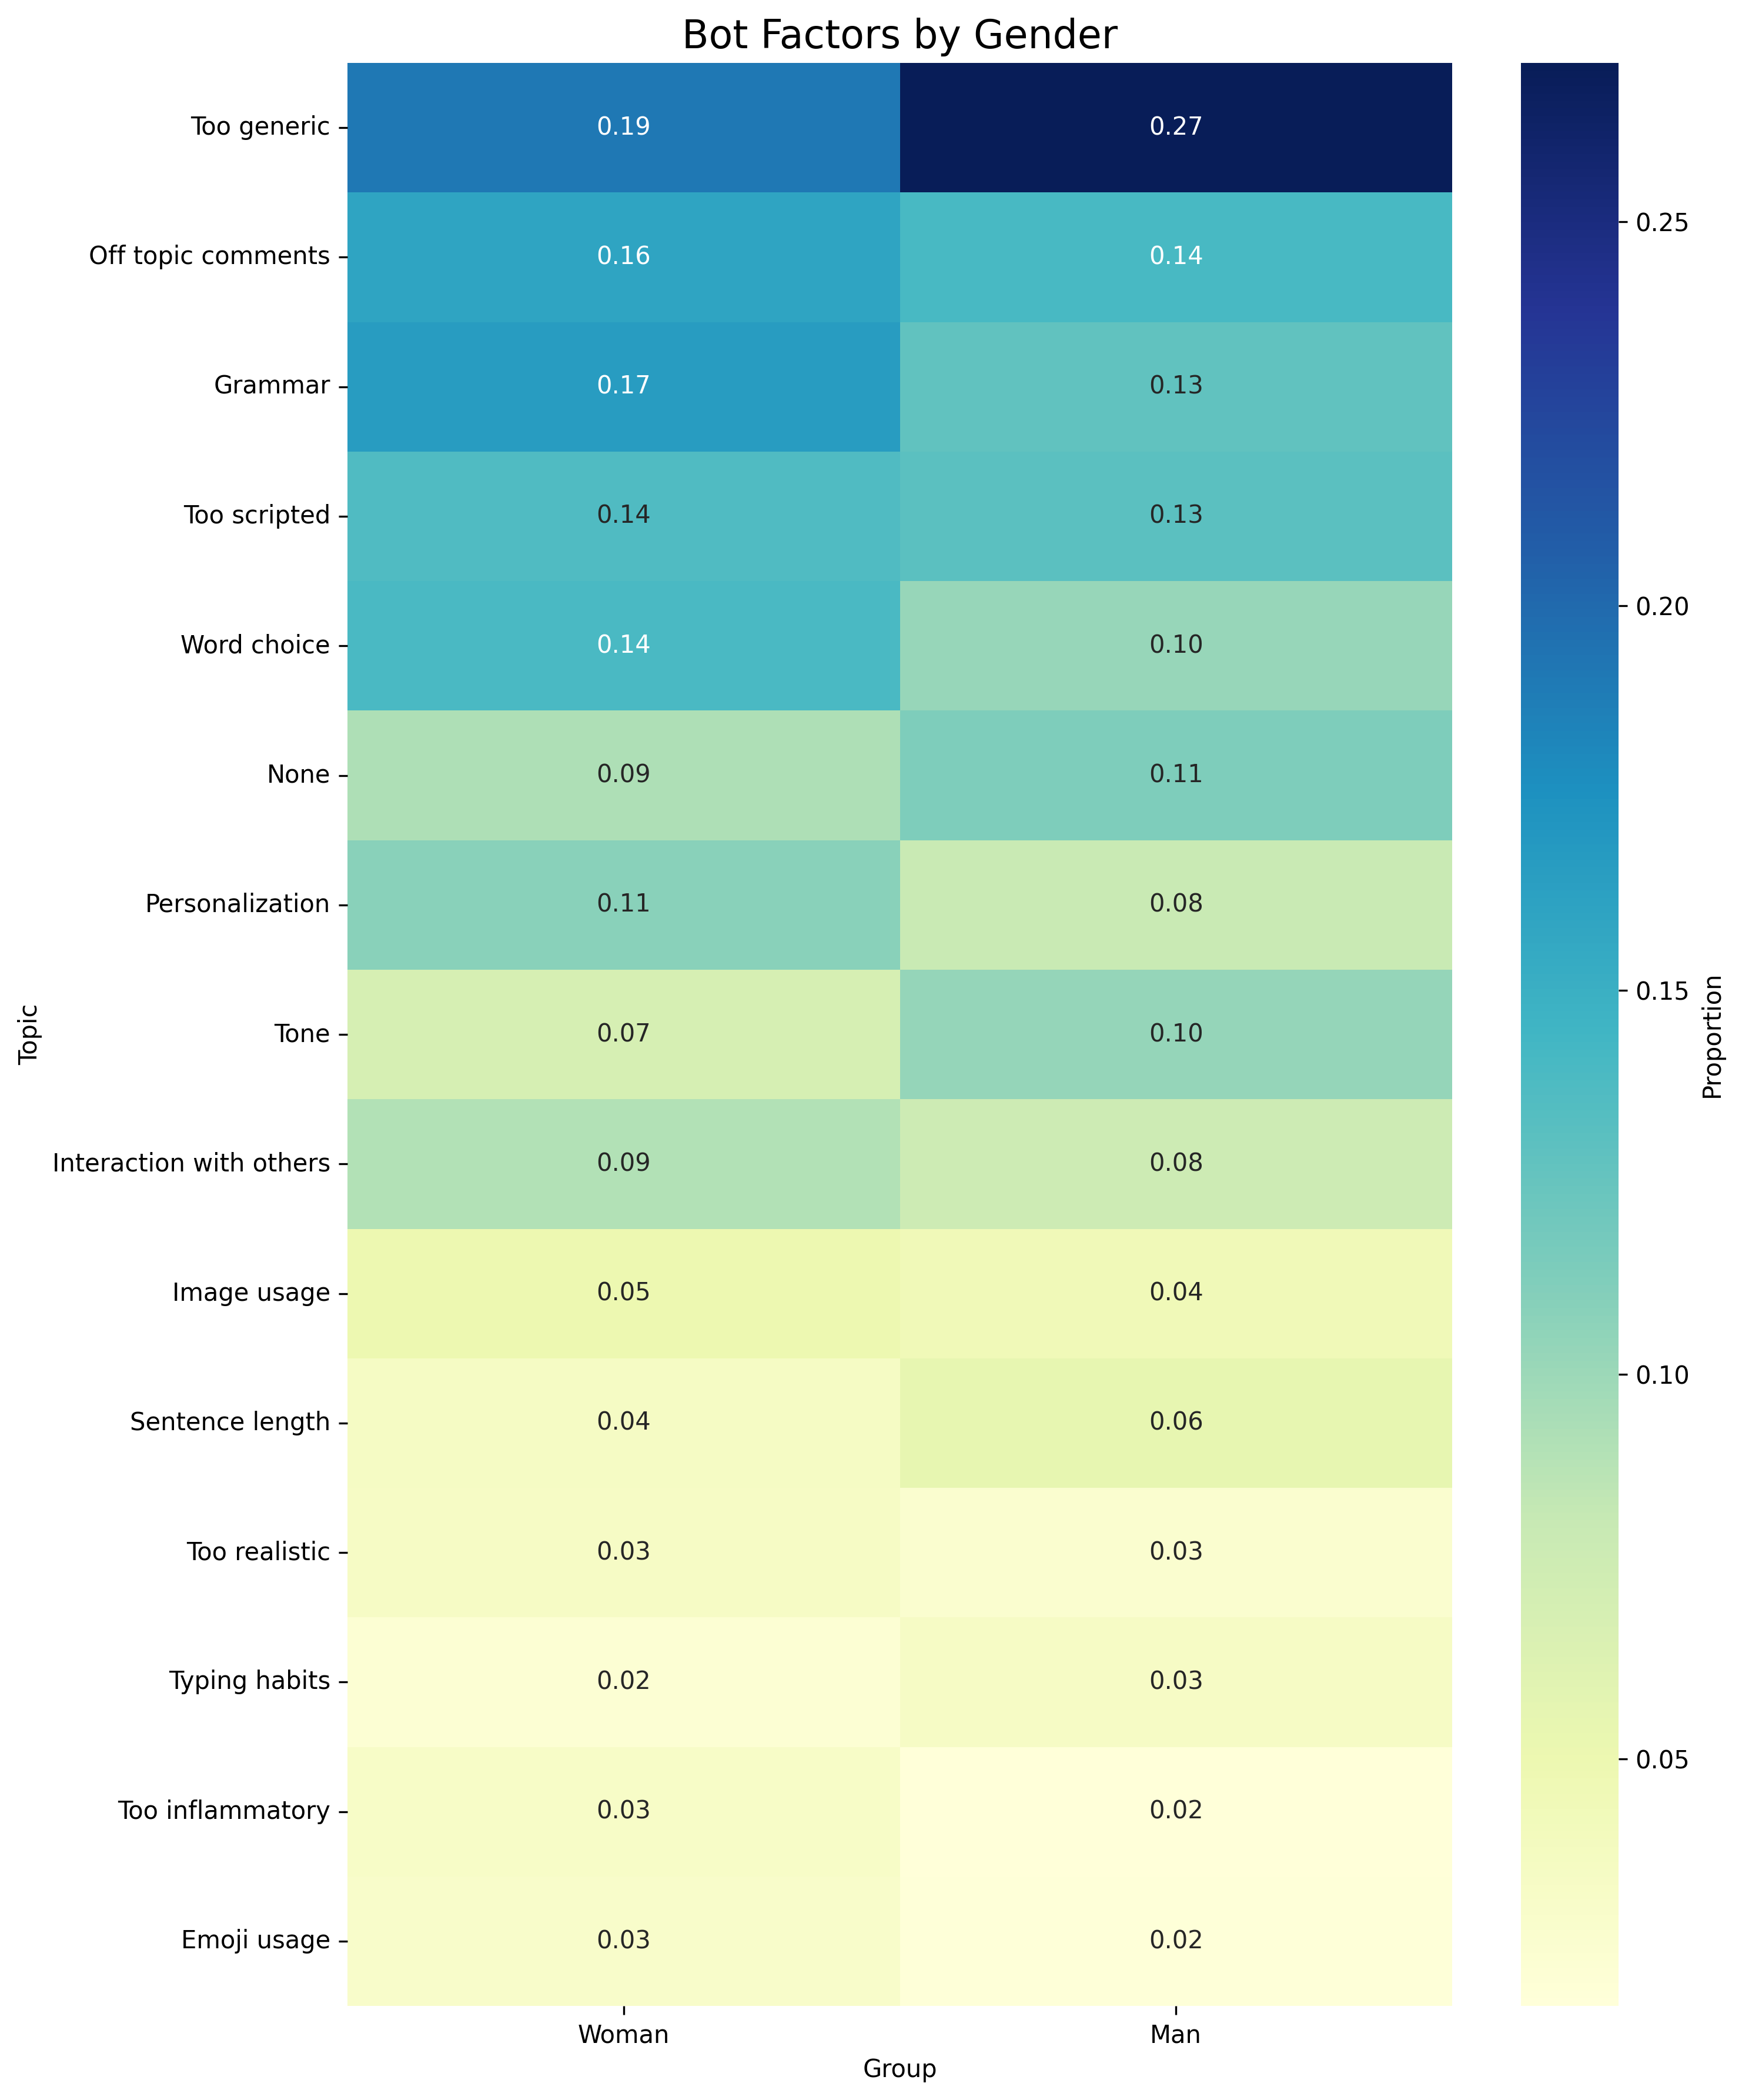
Bot Factors by Gender
This heatmap shows the proportion of respondents by gender who mentioned each bot factor.
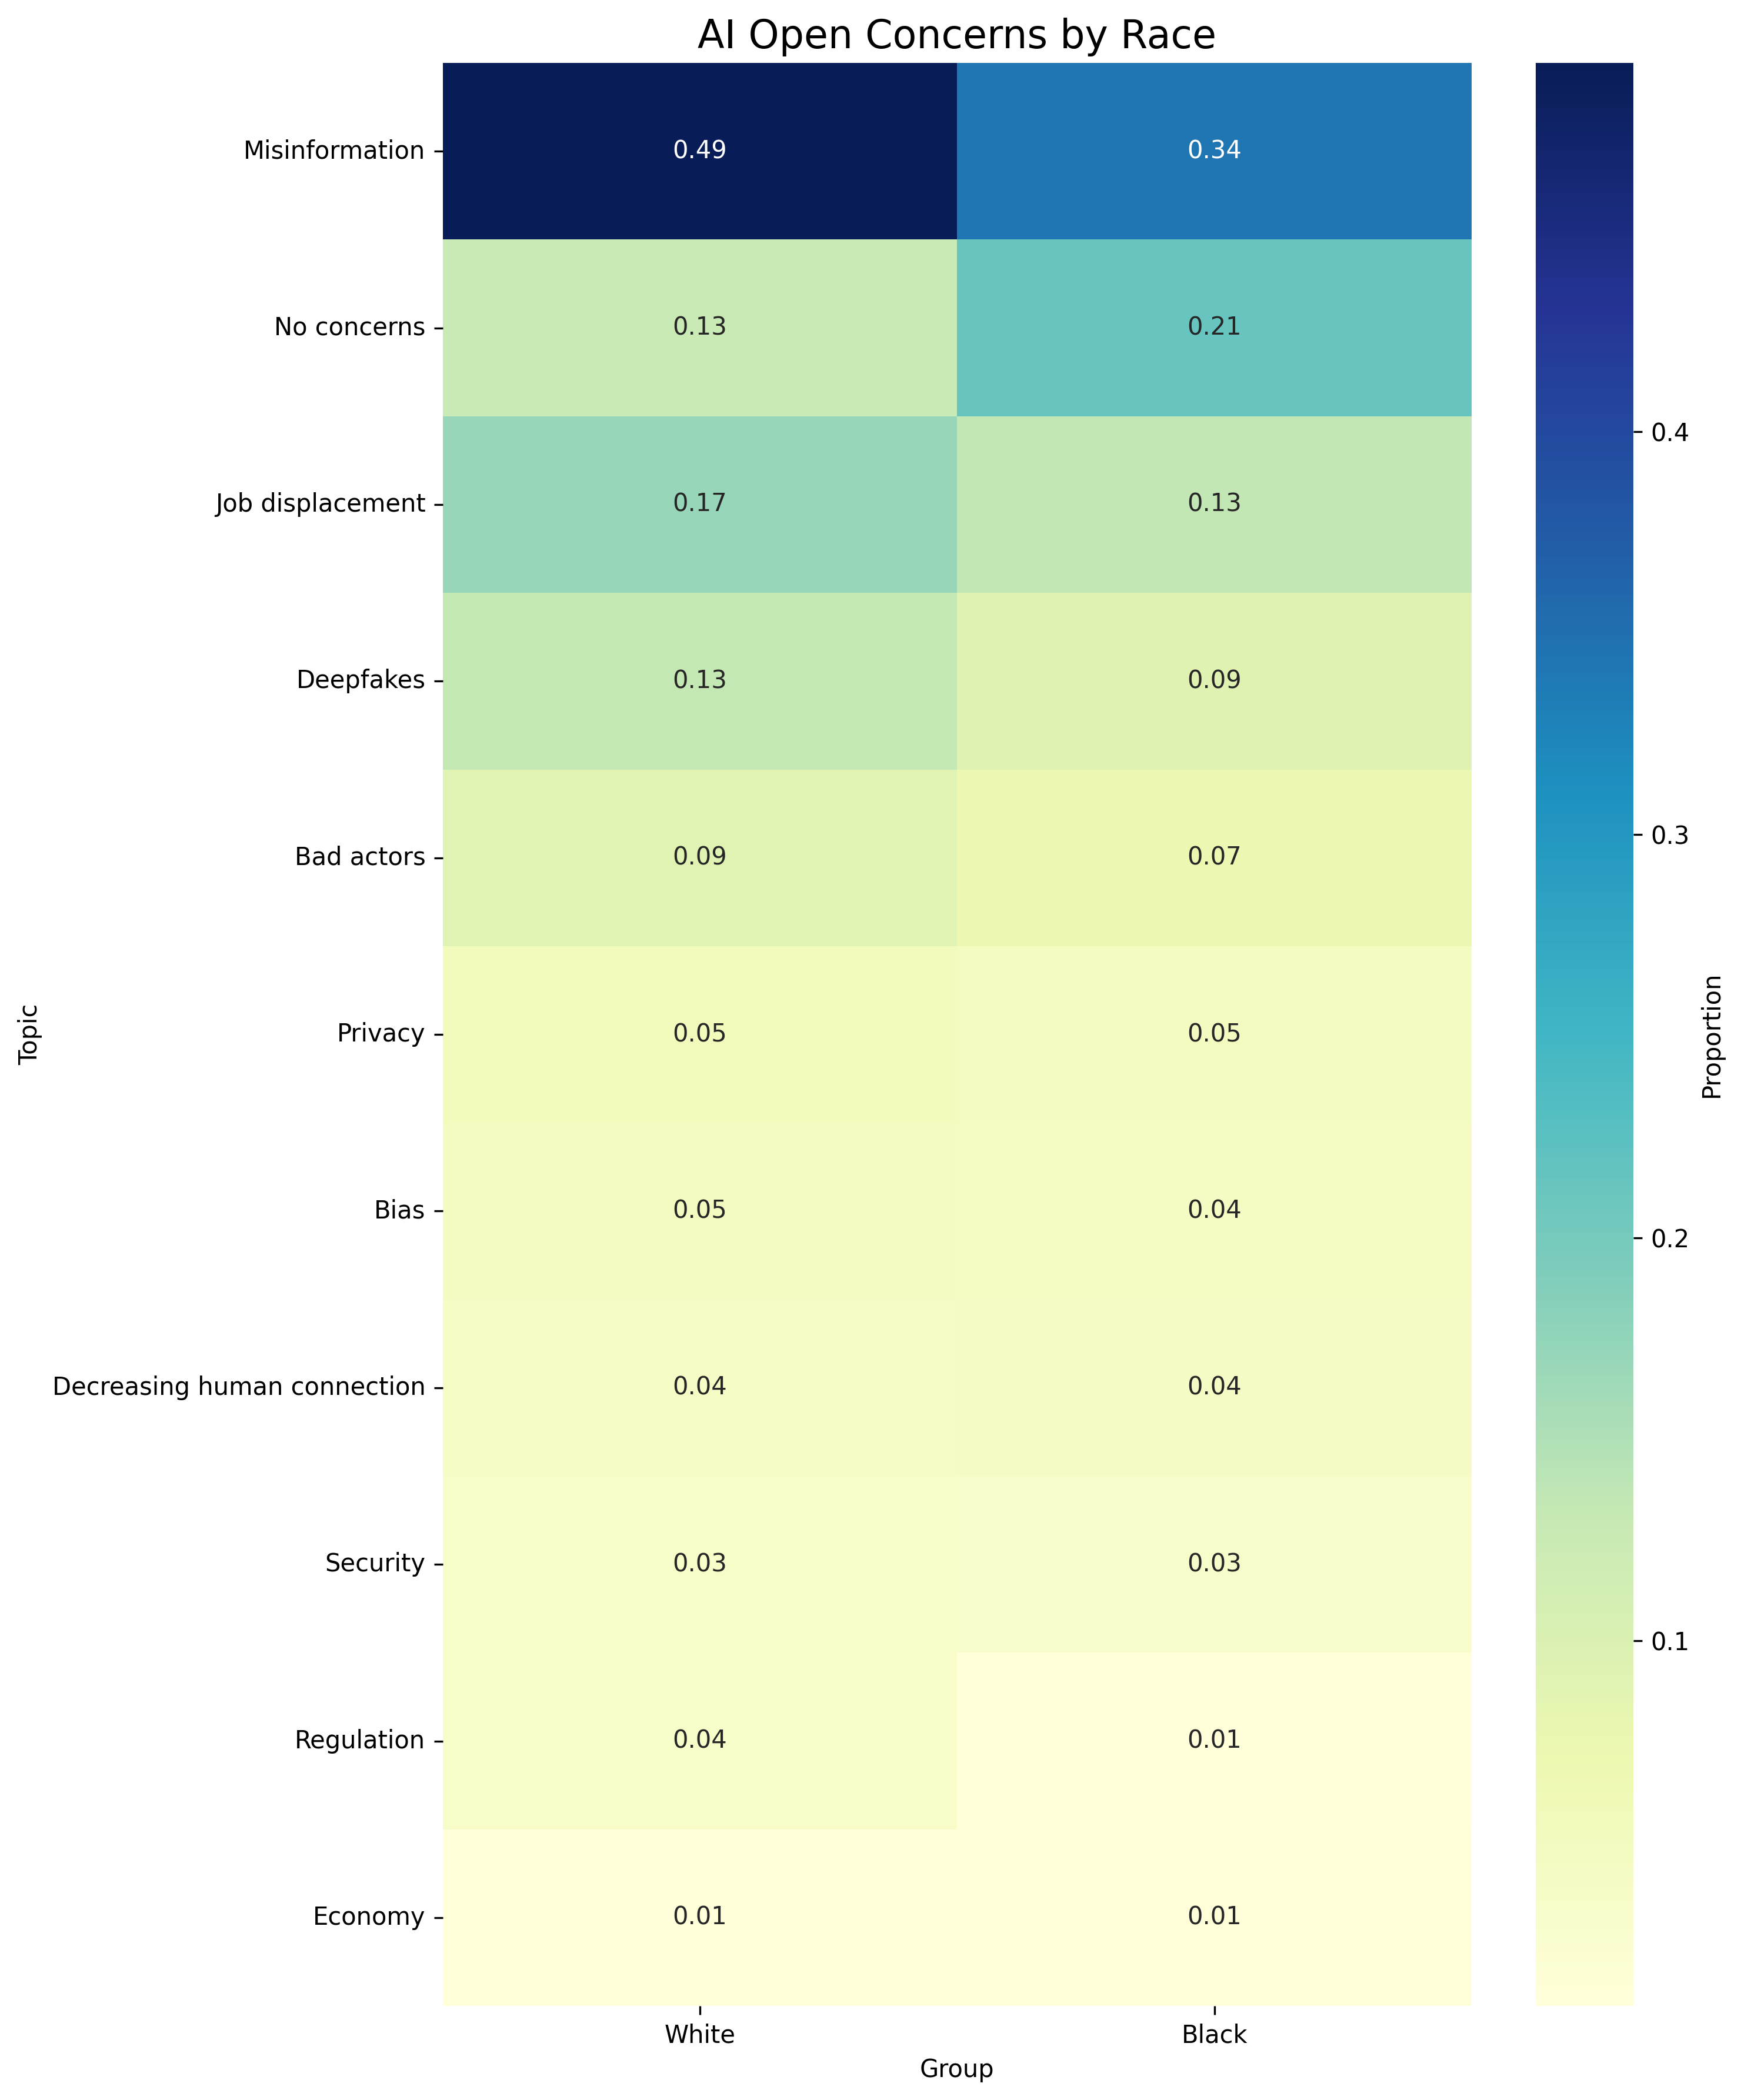
Race Heatmaps
AI Open Concerns by Race
This heatmap shows the proportion of respondents by racial group who mentioned each AI concern topic.
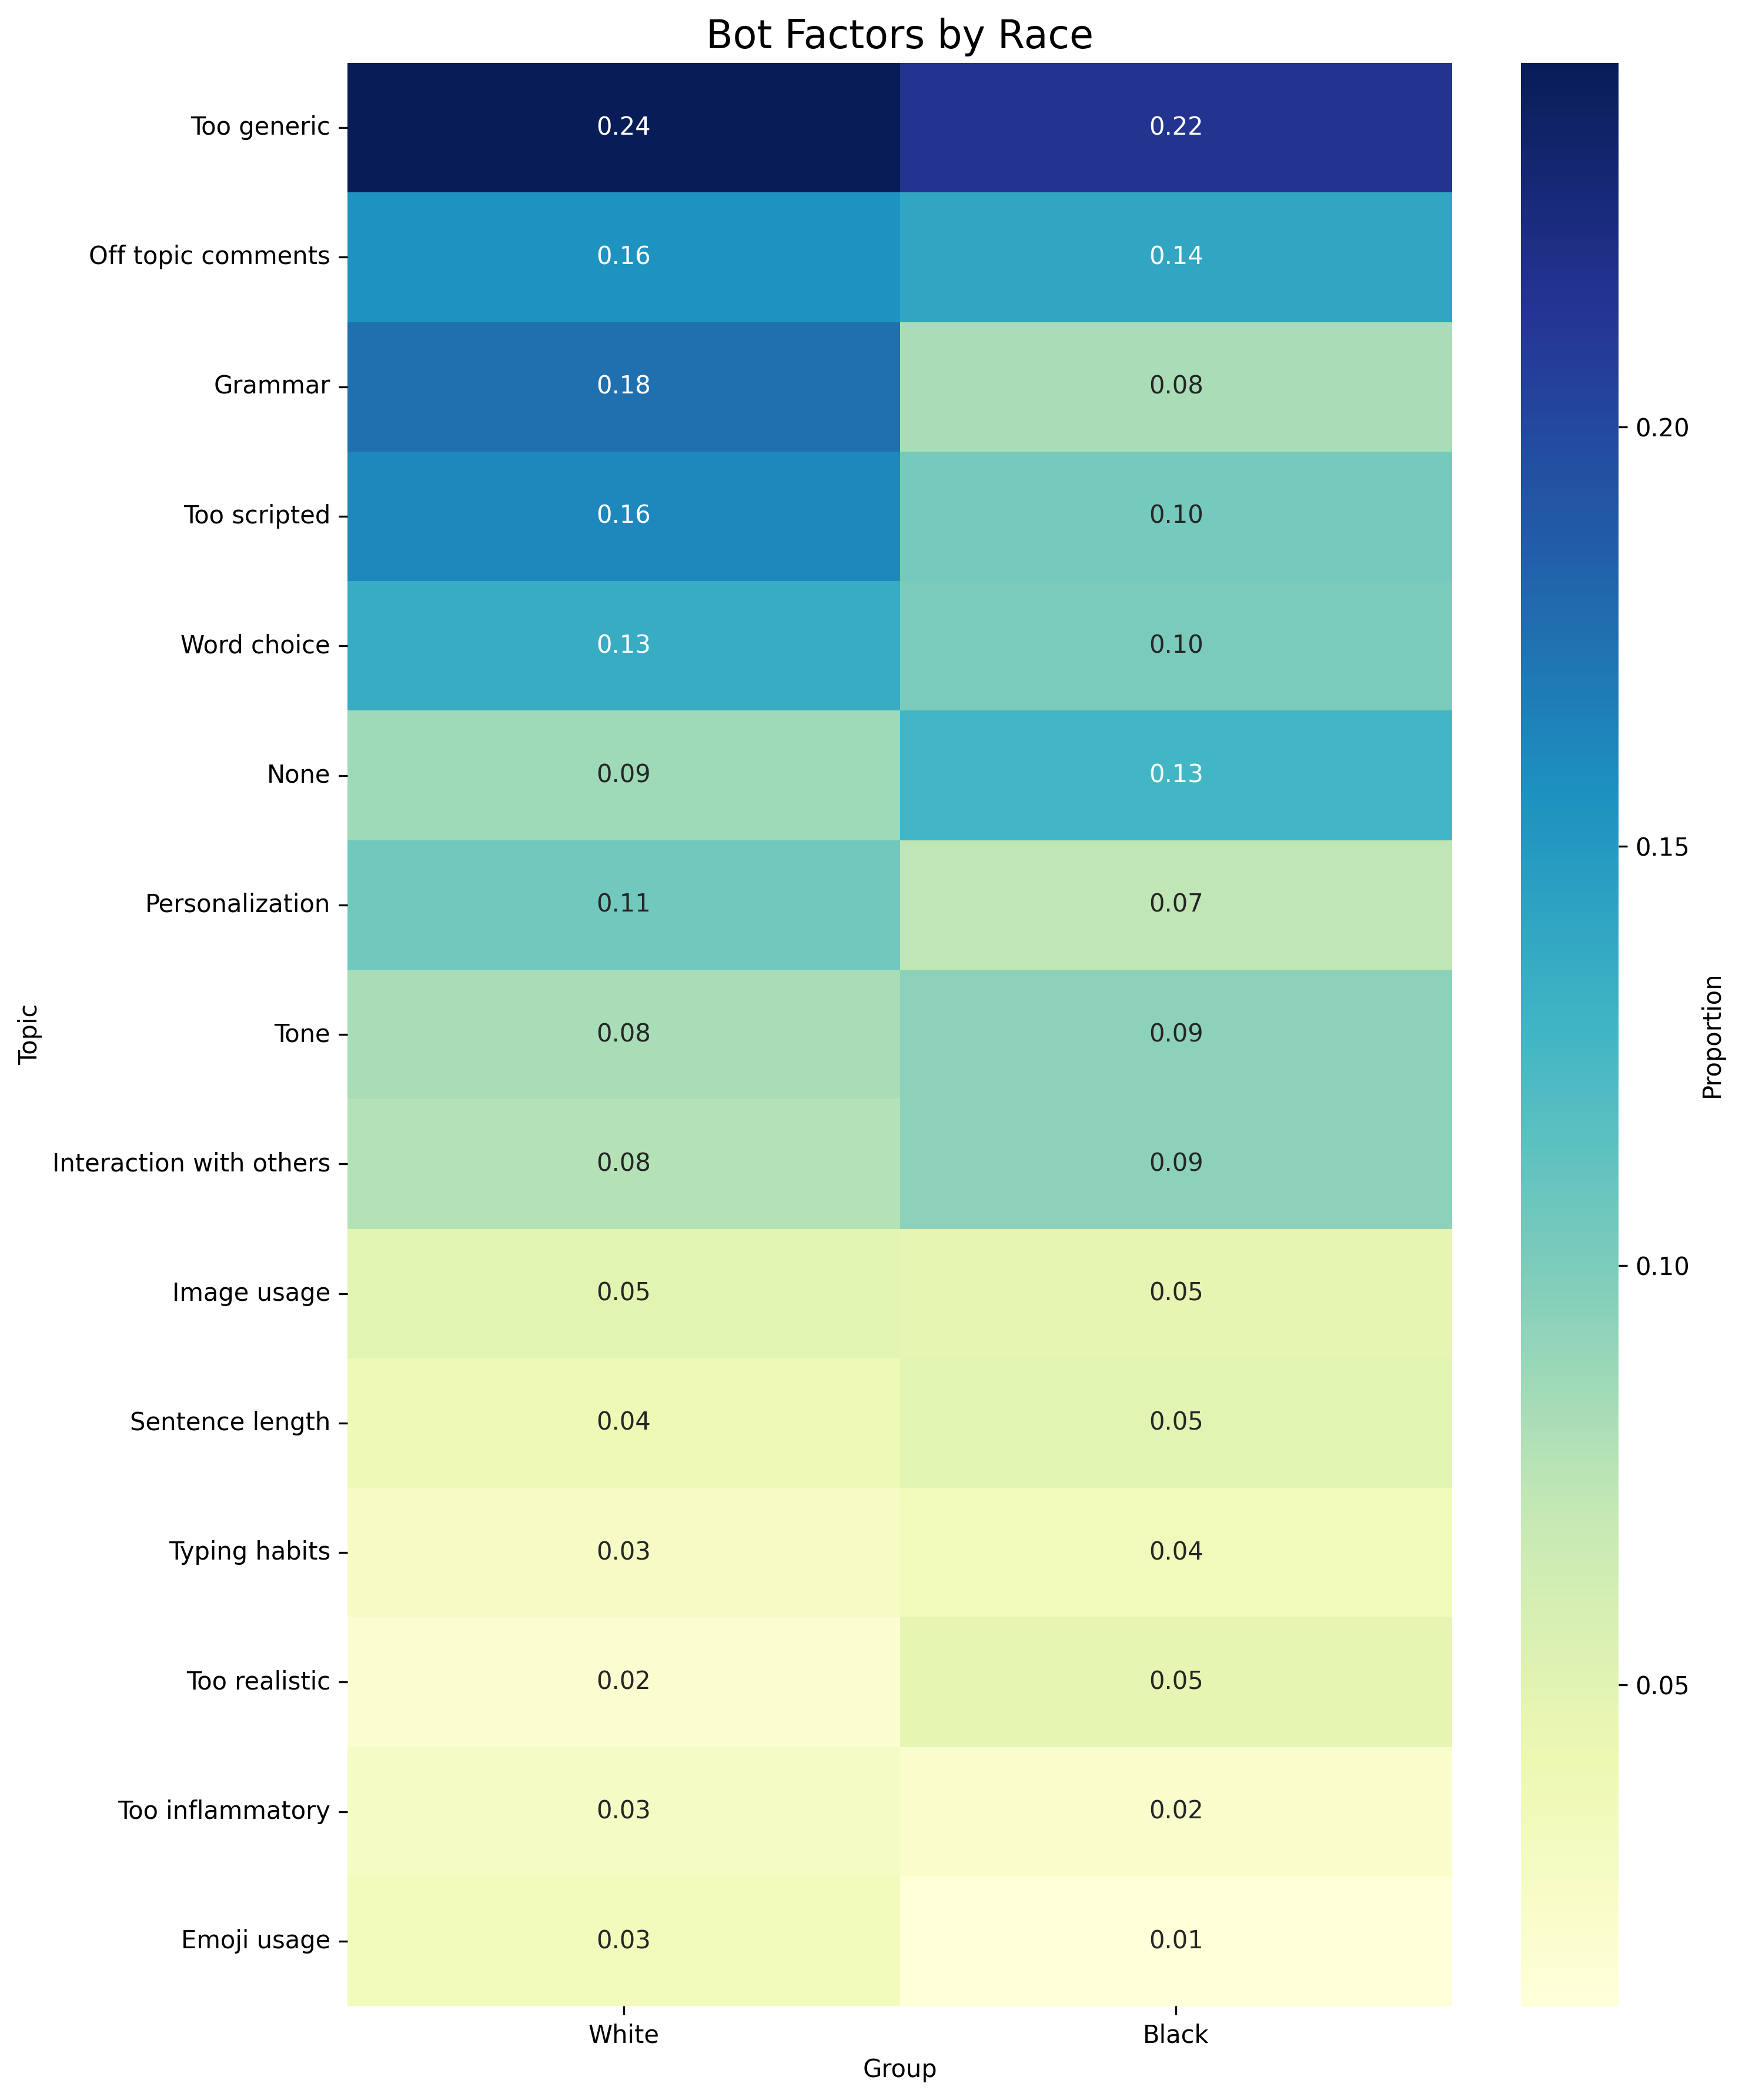
Bot Factors by Race
This heatmap shows the proportion of respondents by racial group who mentioned each bot factor.
Political Affiliation Heatmaps
AI Open Concerns by Political Affiliation
This heatmap shows the proportion of respondents by political affiliation who mentioned each AI concern topic.
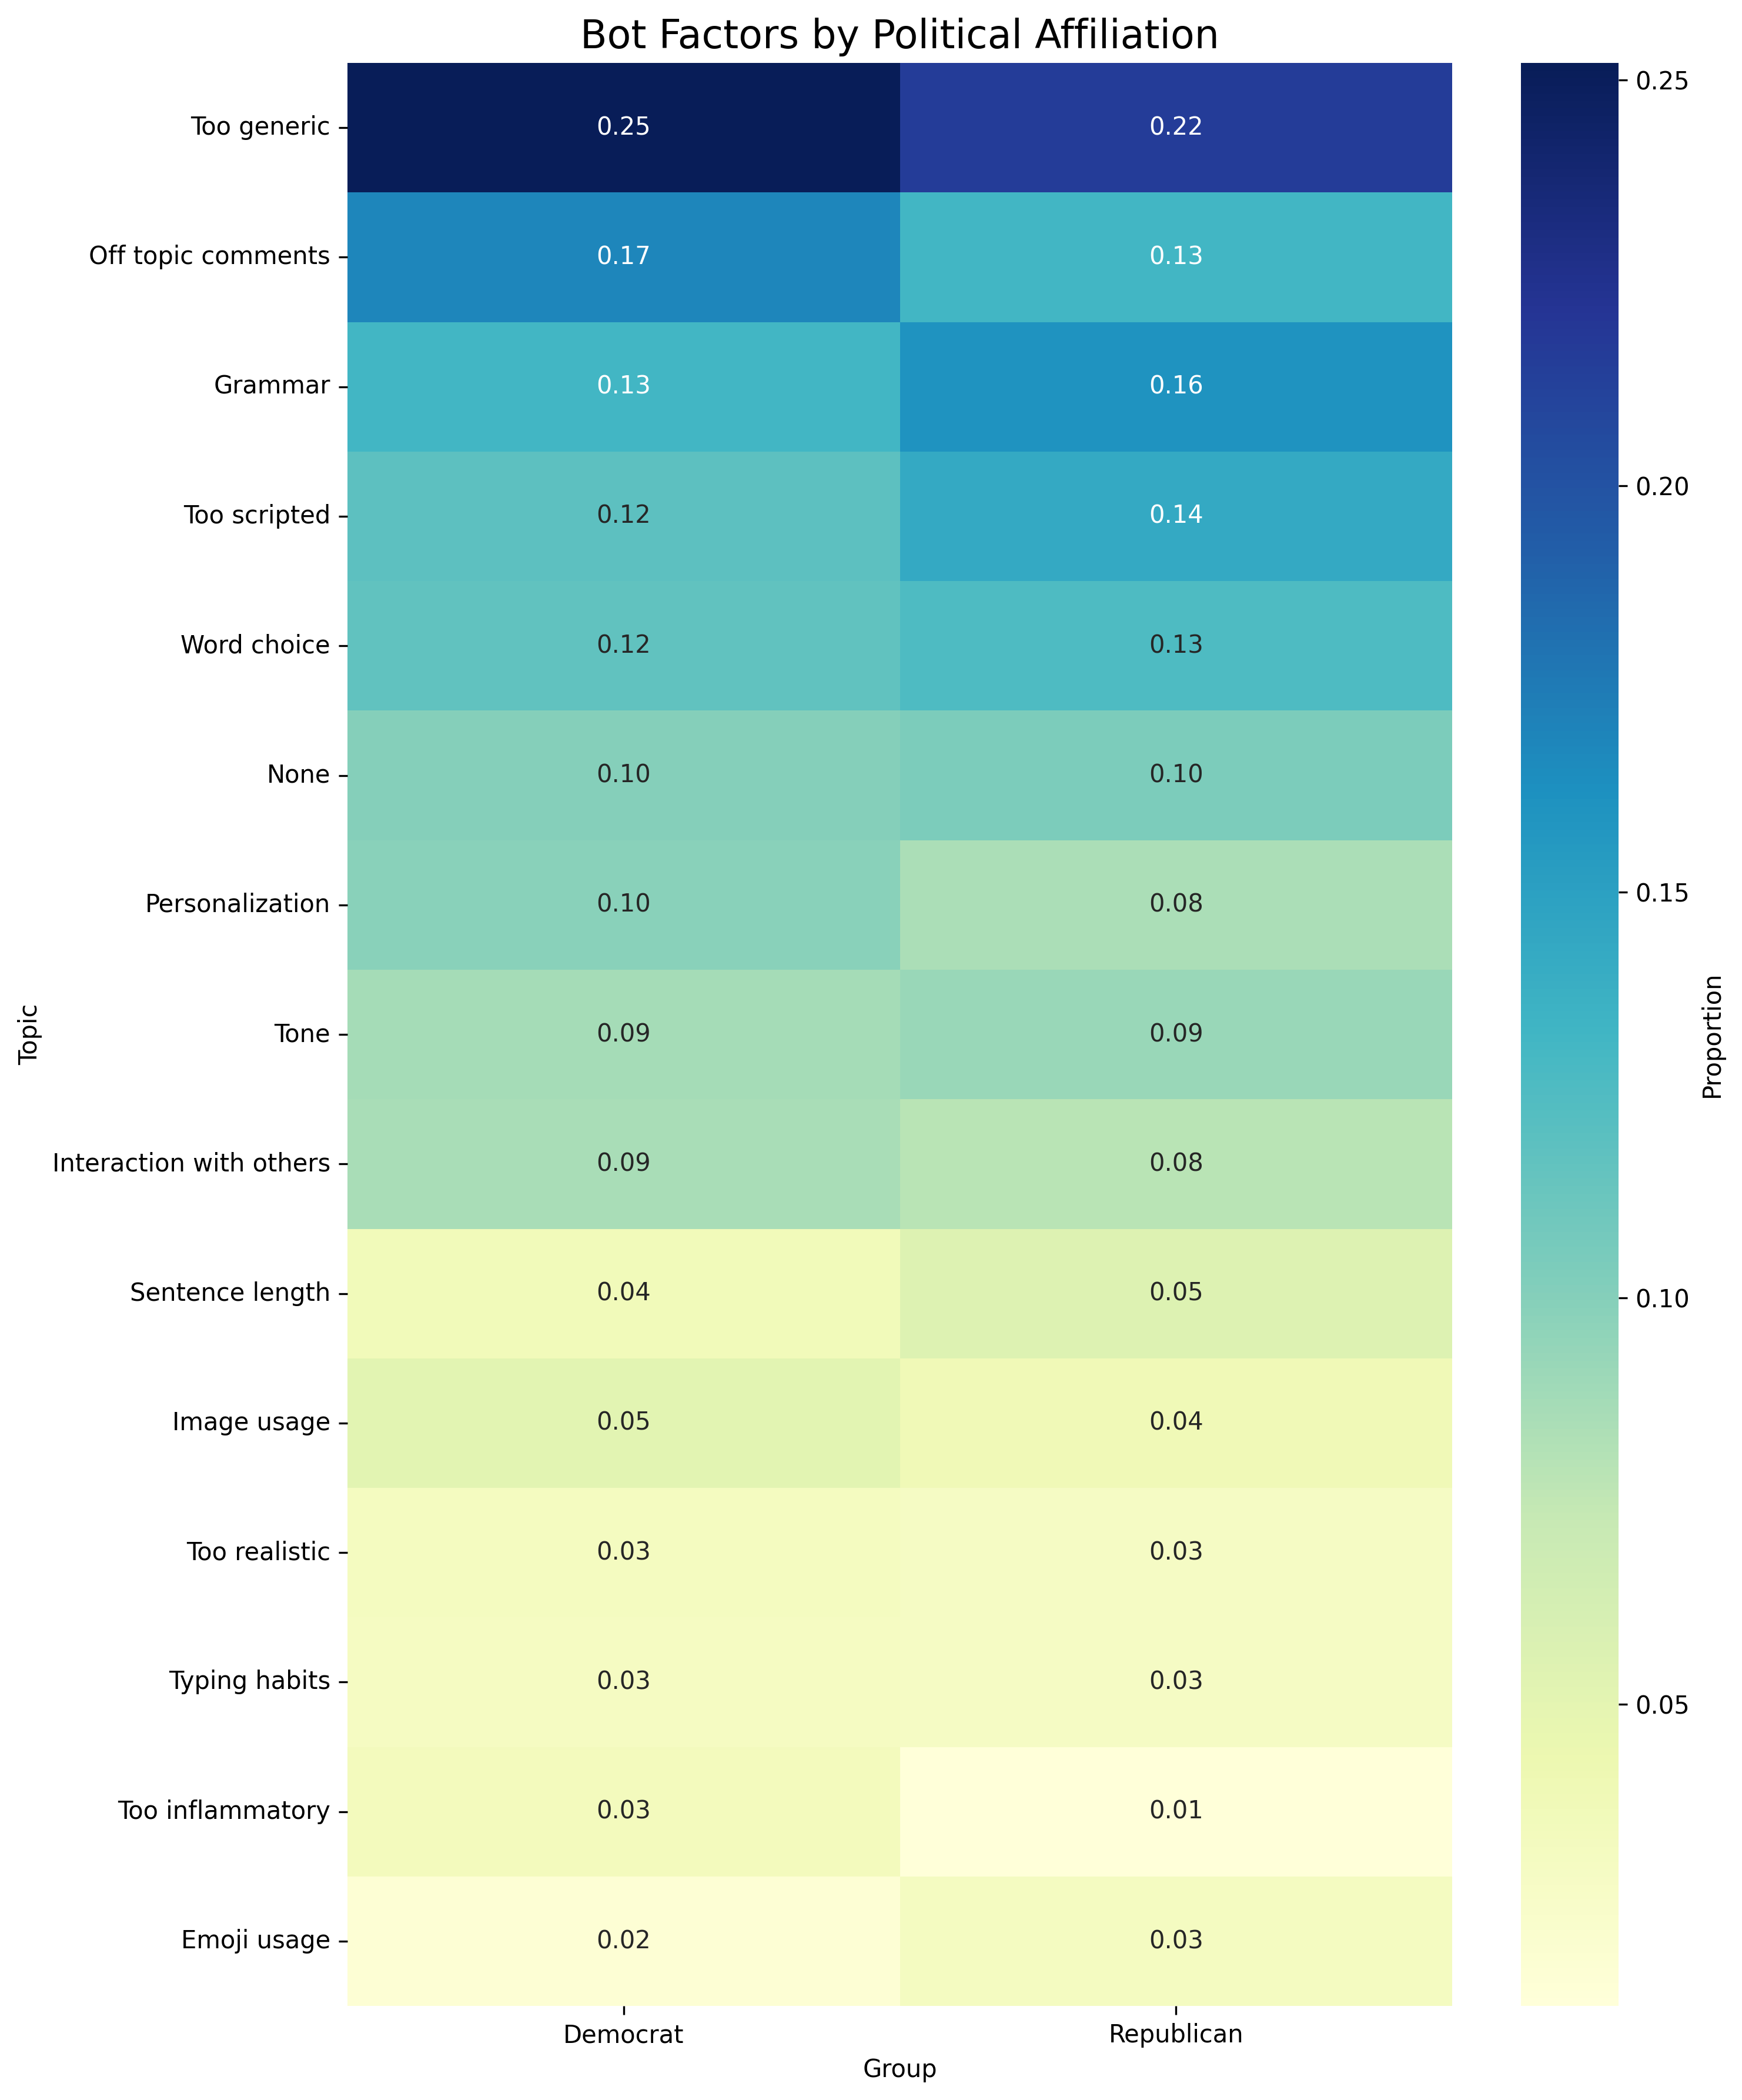
Bot Factors by Political Affiliation
This heatmap shows the proportion of respondents by political affiliation who mentioned each bot factor.
Heatmaps Overview
AI Open Concerns Heatmaps by Demographic Group
These heatmaps show how topics related to AI concerns vary across different demographic groups.
Bot Factors Heatmaps by Demographic Group
These heatmaps show how factors that made profiles seem more bot-like vary across different demographic groups.
Network Metrics Explained
For each network, we calculate several metrics that help us understand the structure and importance of different topics:
Frequency
The number of times a topic was mentioned across all responses. This is the most basic measure of a topic's prevalence.
In the visualizations, node size is typically proportional to frequency.
Degree Centrality
Measures how connected a topic is to other topics. It's calculated as the number of connections (edges) a topic has, divided by the maximum possible connections.
Topics with high degree centrality act as "hubs" in the conversation, connecting to many other topics.
Betweenness Centrality
Measures how often a topic serves as a bridge between other topics. It's calculated based on the number of shortest paths between other topics that pass through a given topic.
Topics with high betweenness centrality often connect different clusters or themes in the conversation.
Closeness Centrality
Measures how close a topic is to all other topics in the network. It's calculated as the reciprocal of the sum of the shortest path distances from a topic to all other topics.
Topics with high closeness centrality can quickly "reach" or relate to many other topics in the conversation.
Eigenvector Centrality
Measures how connected a topic is to other well-connected topics. Unlike degree centrality, which just counts connections, eigenvector centrality considers the quality of those connections.
Topics with high eigenvector centrality are connected to topics that are themselves well-connected, indicating influence within influential clusters.